

Attribution

Which ads really bring your orders

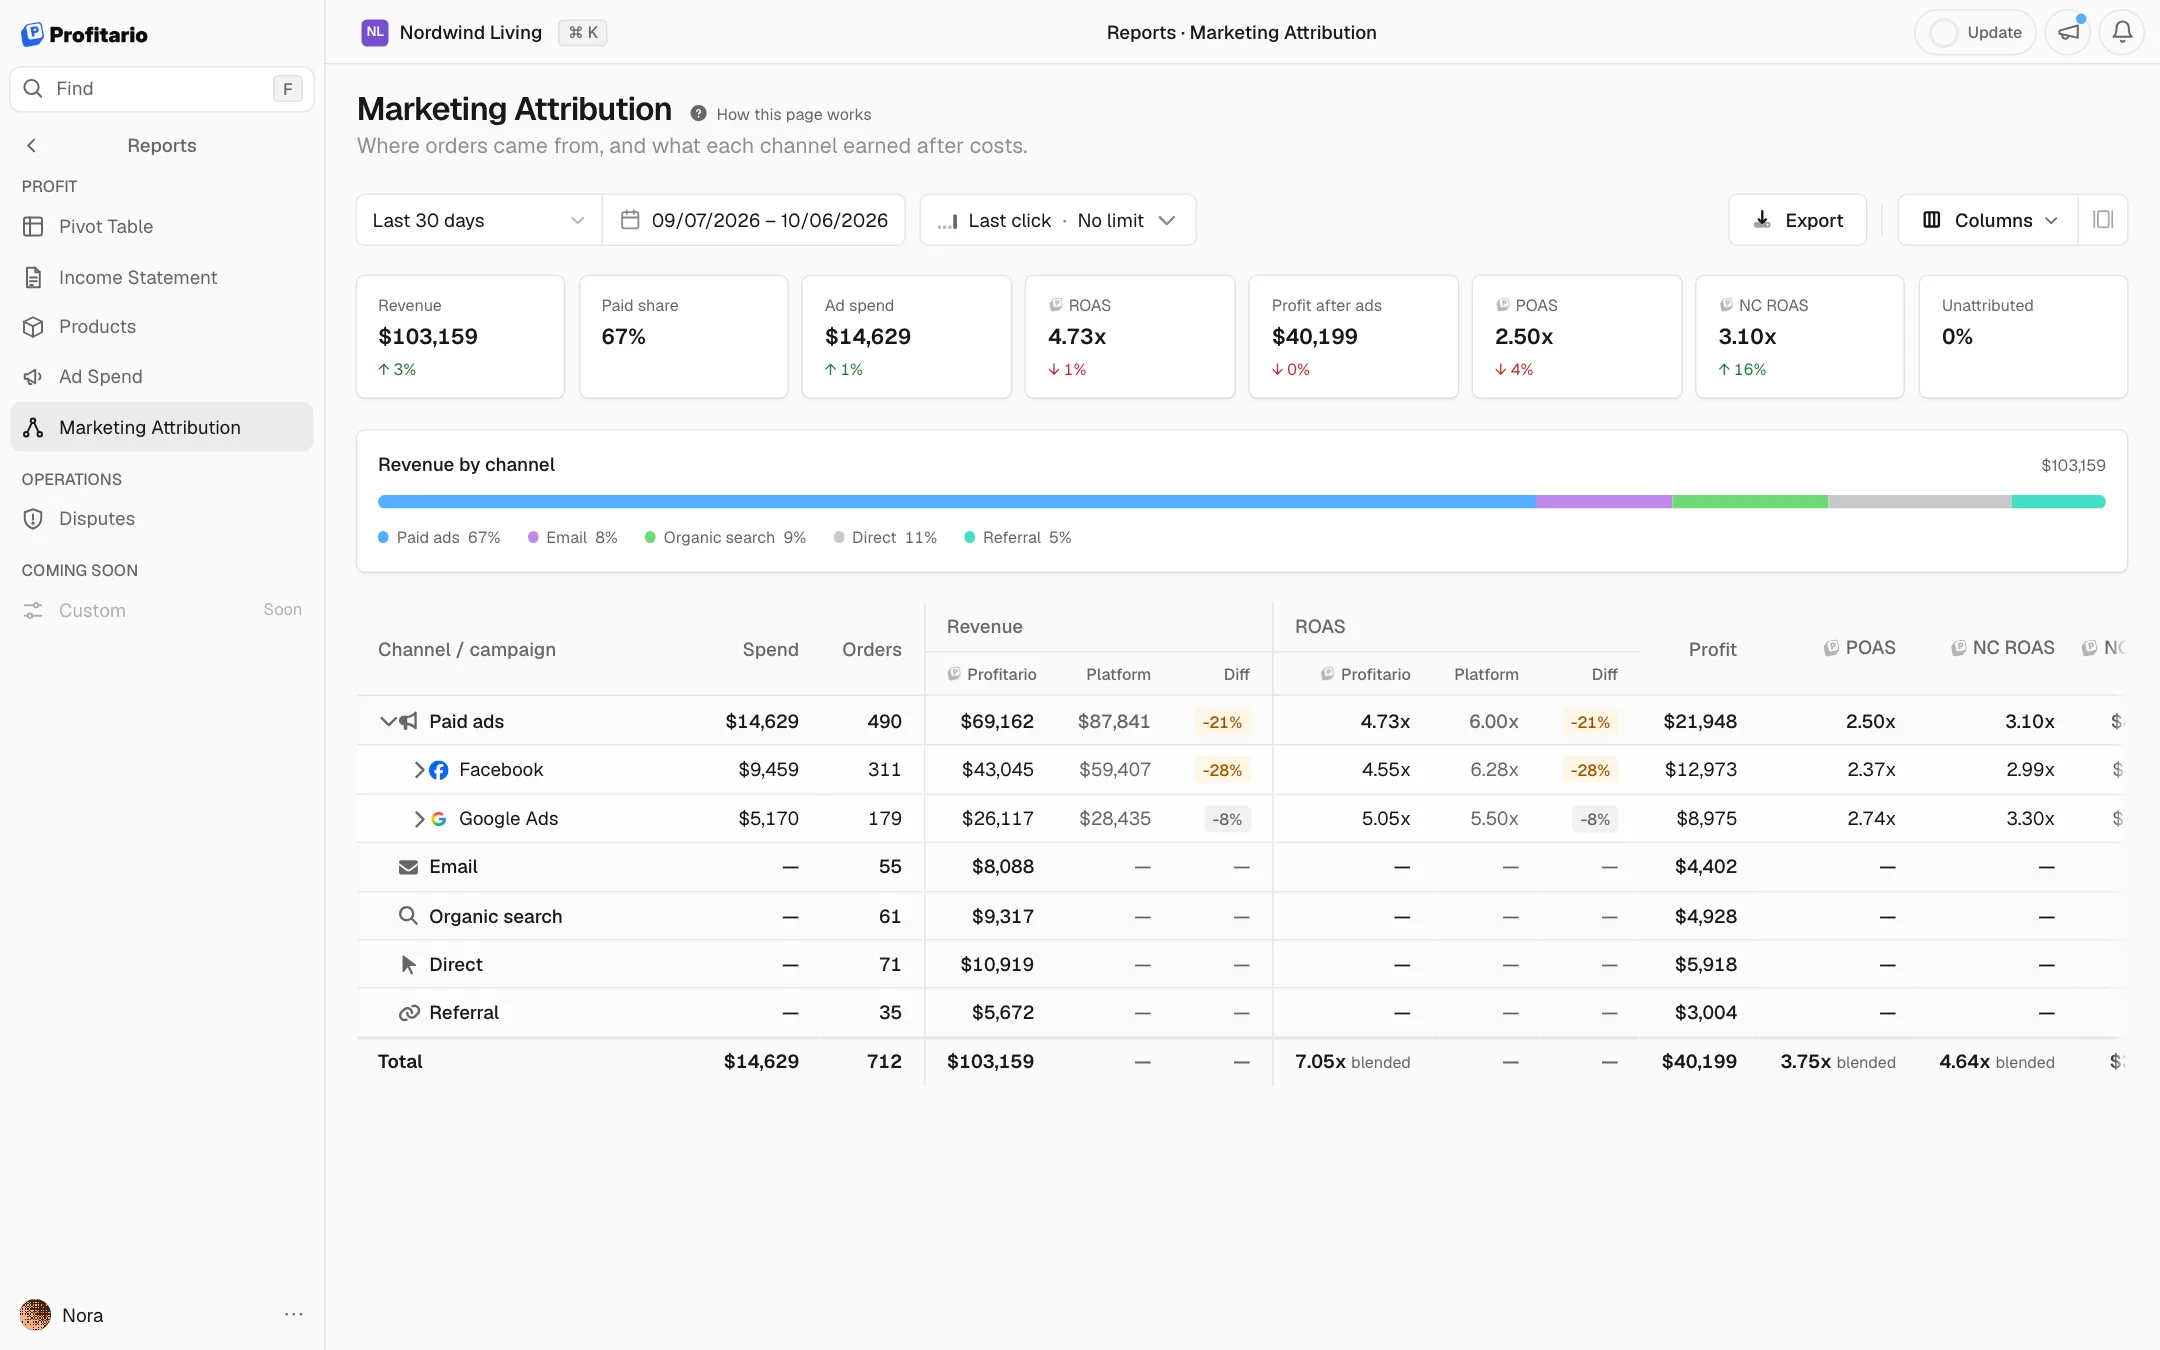
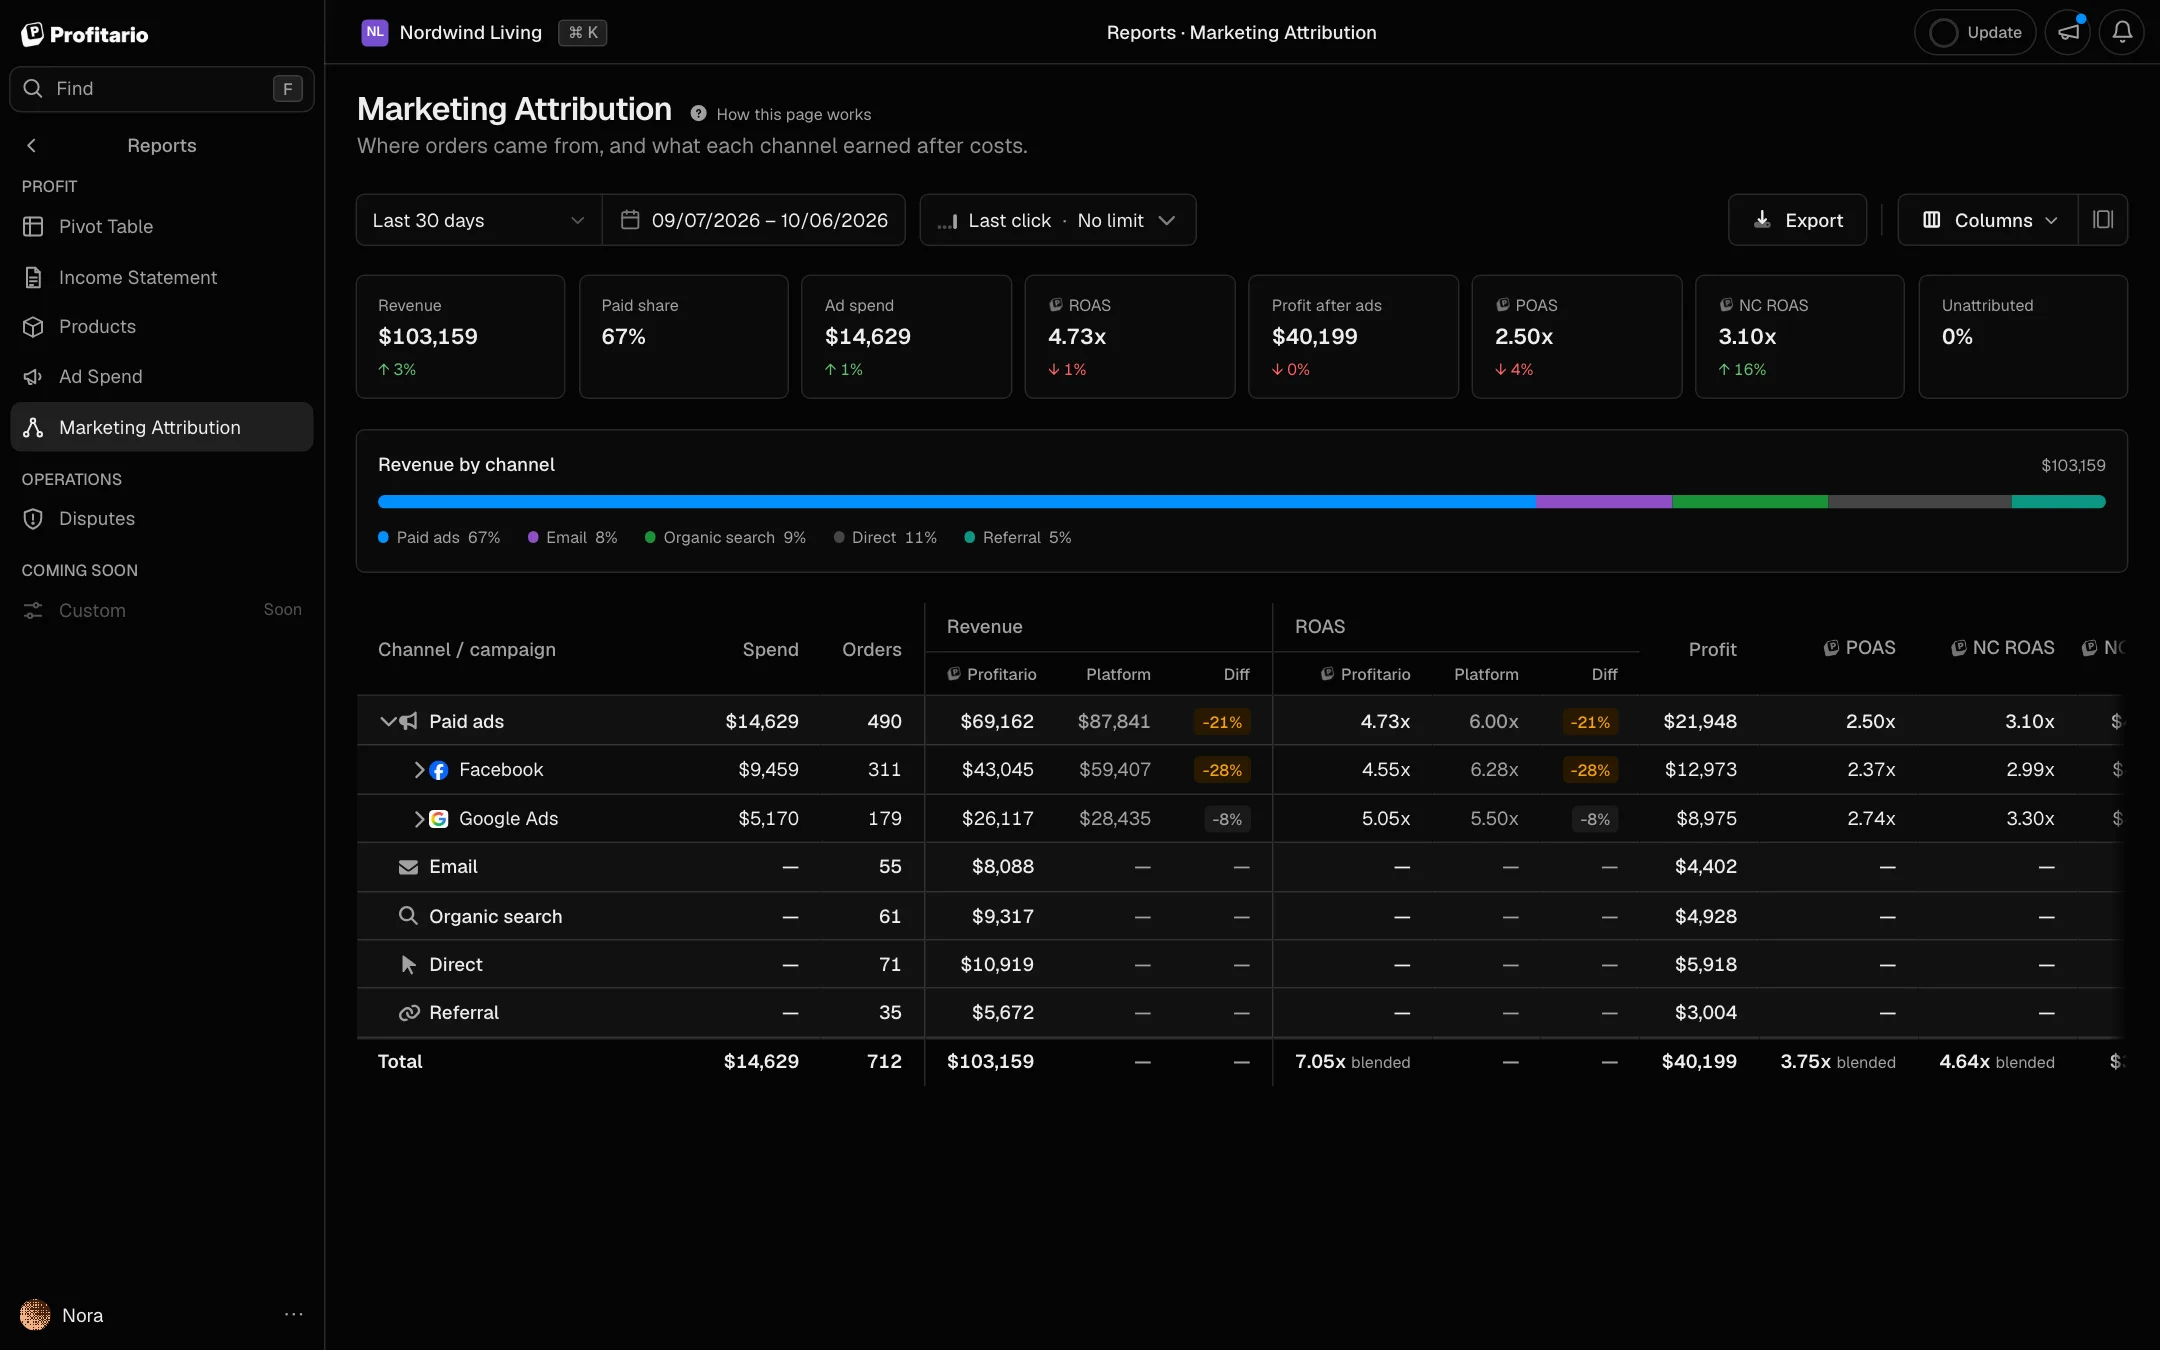
Every order credited to a channel, platform and campaign, with spend, profit, POAS and new-customer ROAS next to what the ad platform reports.

Sample data
Which ads really bring your orders

How it helps

Shopify marketing attribution that ends in profit, not platform ROAS

Each ad platform counts its own conversions, and together they often claim more orders than the store received. This Shopify marketing attribution report credits every order once, from your own tracking, and carries it through to profit per campaign.

  1. 01

    One source of truth for every order

    Orders are credited from UTM tracking on your Shopify store, click IDs and the Profitario Pixel, then matched to synced campaigns. Each order counts once, so channel totals add up to your revenue and campaigns can be compared fairly.

  2. 02

    Budget decisions on profit

    POAS divides the contribution margin of credited orders by ad spend, after product, shipping and fee costs. A campaign with a good ROAS on low-margin products shows up as the loss it is.

  3. 03

    Gaps you can fix

    Orders with broken UTMs, paid clicks with no campaign match and orders without a click stay visible as their own rows, each with the most common values and a fix. Better tracking moves more orders into campaigns over time.

Features

What the report shows

Loading 0%

Tracing visits0%
Touchpoints

Order #13172 · visits before it

6 days before
2 days before
40 min before
Order

Prospecting · Video 3

Meta Ads · 6 days before

Credited

$349.00

Channels down to campaigns

Paid ads, email, organic, direct and referral in one table, with paid ads opened up by platform and campaign. Every order lands in one row, so the total matches your revenue.

Matching campaigns0%
Revenue by campaign

Credited revenue · last 30 days

  • Catalog Sales3.6×

    $2,730 spend

    $9,840
  • Retargeting · 30d4.1×

    $1,490 spend

    $6,120
  • Lookalike 2%1.9×

    $1,740 spend

    $3,310
  • Broad US0.8×

    $1,400 spend

    $1,120

Your numbers next to the platform

Revenue, ROAS, orders and CPA from your own store sit beside what Meta, Google or TikTok report, with the difference for each campaign.

Crediting revenue0%
Catalog Sales

Meta · credited revenue vs spend

$9,8403.6×
$0
$200
$400
$600
Sep 6Sep 9Sep 12Sep 15Sep 18
RevenueSpend

Profit and POAS per campaign

Contribution margin after product, shipping and fee costs, profit after ad spend and POAS for every campaign, plus ROAS and CPA for new customers only.

Connecting pixel0%
Profitario Pixel

Your store, last few seconds

0 events/min
  • page_viewed/products/standing-desknow
  • page_viewed/collections/chairs2s
  • checkout_completed#13172 · $349.004s
  • checkout_started$349.006s

Models, windows and comparison

Switch between first click, last click and linear, set a 1, 7, 14 or 28-day or lifetime click window, and compare models side by side to find openers and closers.

Running the example store0%

100 recent orders

Each square is one order

MetaGoogleTikTokNo ad

Spend this month · matched orders

Catalog Sales$2,73041 orders
Shopping · All$1,96024 orders
Broad US$1,4000 orders
Interest test$1,0800 orders
Spend with no matched orders$2,480
  1. 01 · MatchMatch more orders to an ad52 → 78
  2. 02 · ExposeSee spend that brings no orders$2,480
  3. 03 · ShiftMove it to what converts$900/mo

With full click URLs from your own pixel, 78 of 100 orders match an ad instead of 52.

In the report: Profitario Pixel

Scale the campaigns that bring orders

Example: 100 orders and four campaigns spending $7,170 this month.

Questions it answers

From a question to the next step

  1. 01 · You ask

    Which campaigns make money after costs?

    Why it matters: ROAS can look healthy while low margins and shipping eat the return. POAS shows which campaigns add profit, which is what the budget should follow.

    The report shows

    Profit and POAS per campaign: credited margin after product, shipping and fee costs, minus ad spend.

    You act

    Cut or fix campaigns below 1.00x POAS before raising budgets on the ones above it.

    ROAS vs POAS

    Last 30 days · POAS 1.00× is break-even

    ROASPOAS
    • Retargeting · 30d

      $1,490 spend

      4.1×
    • Catalog Sales

      $2,730 spend

      3.6×
    • Lookalike 2%

      $1,740 spend

      1.9×
    • Broad US

      $1,400 spend

      0.8×
  2. 02 · You ask

    Is the platform over-reporting?

    Why it matters: Platforms count view-through and modeled conversions and credit the same order to several ads. Your own Shopify ROAS tracking keeps the budget from following claims that never reached the store.

    The report shows

    Revenue and ROAS from your store next to the platform figures, with the difference per campaign.

    You act

    Where the platform claims far more than your store credits, judge the campaign on your numbers before scaling it.

    Store ROAS vs platform

    Meta campaigns · last 30 days

    ProfitarioMeta reported
    • Retargeting · 30d
      3.1×
      5.6×
    • Catalog Sales
      2.4×
      3.9×
    • Prospecting · Broad
      1.2×
      2.7×
    ProfitarioMeta reported
  3. 03 · You ask

    Which campaigns bring new customers?

    Why it matters: Retargeting often collects credit for customers who would have bought anyway. New-customer ROAS and CPA show which campaigns grow the customer base.

    The report shows

    New-customer orders, revenue, ROAS and CPA per campaign.

    You act

    Fund prospecting on new-customer CPA and keep retargeting budgets in check when they mostly reach existing buyers.

    New customers by campaign

    Last 30 days · first orders only

    CampaignNewShareNC CPA
    • Prospecting · Broad
      61
      82%
      $31.00
    • Shopping · All
      38
      54%
      $58.20
    • Retargeting · 30d
      13
      15%
      $118.00
    • Brand Search
      9
      20%
      $45.60
    All campaigns
    121
    44%
    $49.95
  4. 04 · You ask

    Does first click tell a different story?

    Why it matters: Last click undervalues the campaigns that start journeys. Comparing models shows which campaigns open journeys and which close them, so neither gets cut by mistake.

    The report shows

    The same campaigns under first click, last click and linear, tagged as opener, closer or balanced.

    You act

    Keep openers funded even when last click shows little, and judge closers on last click.

    Openers and closers

    Credited revenue · last 30 days

    First clickLast click
    • Prospecting · Broad
      $14,200
      $5,300
    • Retargeting · 30d
      $4,200
      $7,600
    • Brand Search
      $3,100
      $9,800
    First clickLast click

Common questions

Questions about the Attribution report

Last click shows which campaign closed the sale, first click shows which one started the journey and the linear attribution model splits credit across every paid click. Profitario lets you switch between them and compare all three per campaign, so you can judge prospecting on first click and retargeting on last click.

Start tracking your real profit today

No credit card required. Free plan available forever.

We value your privacy
We use cookies to enhance your experience. By continuing to use our site, you consent to our use of cookies.

By clicking "Accept All", you consent to our use of cookies.

Learn more