

Profit Dashboard

Your real profit, every day

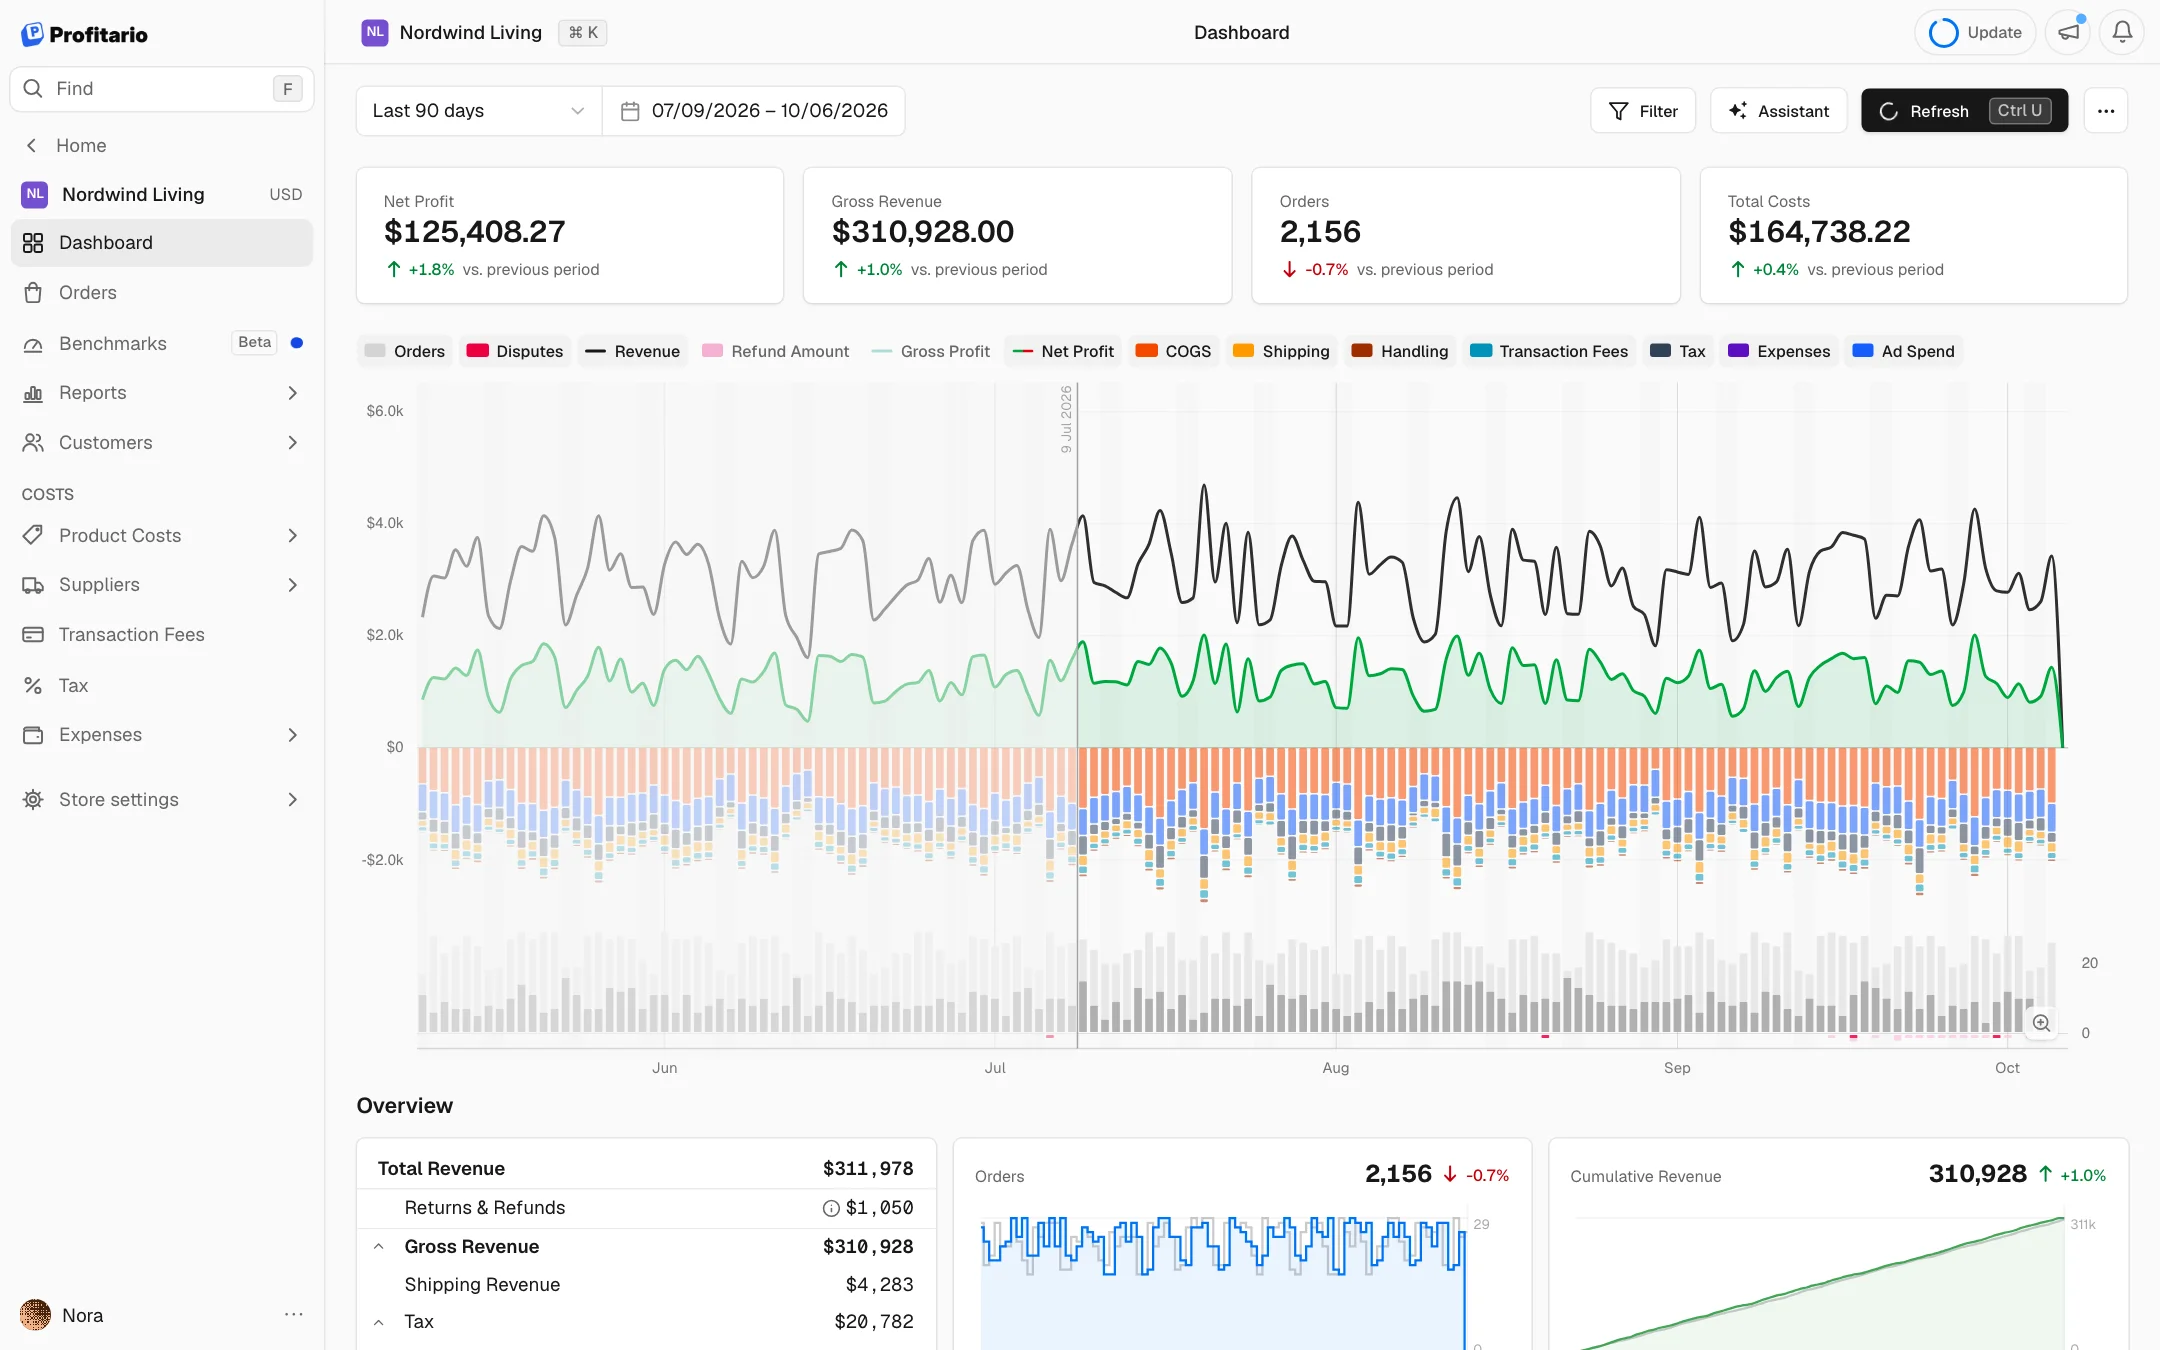
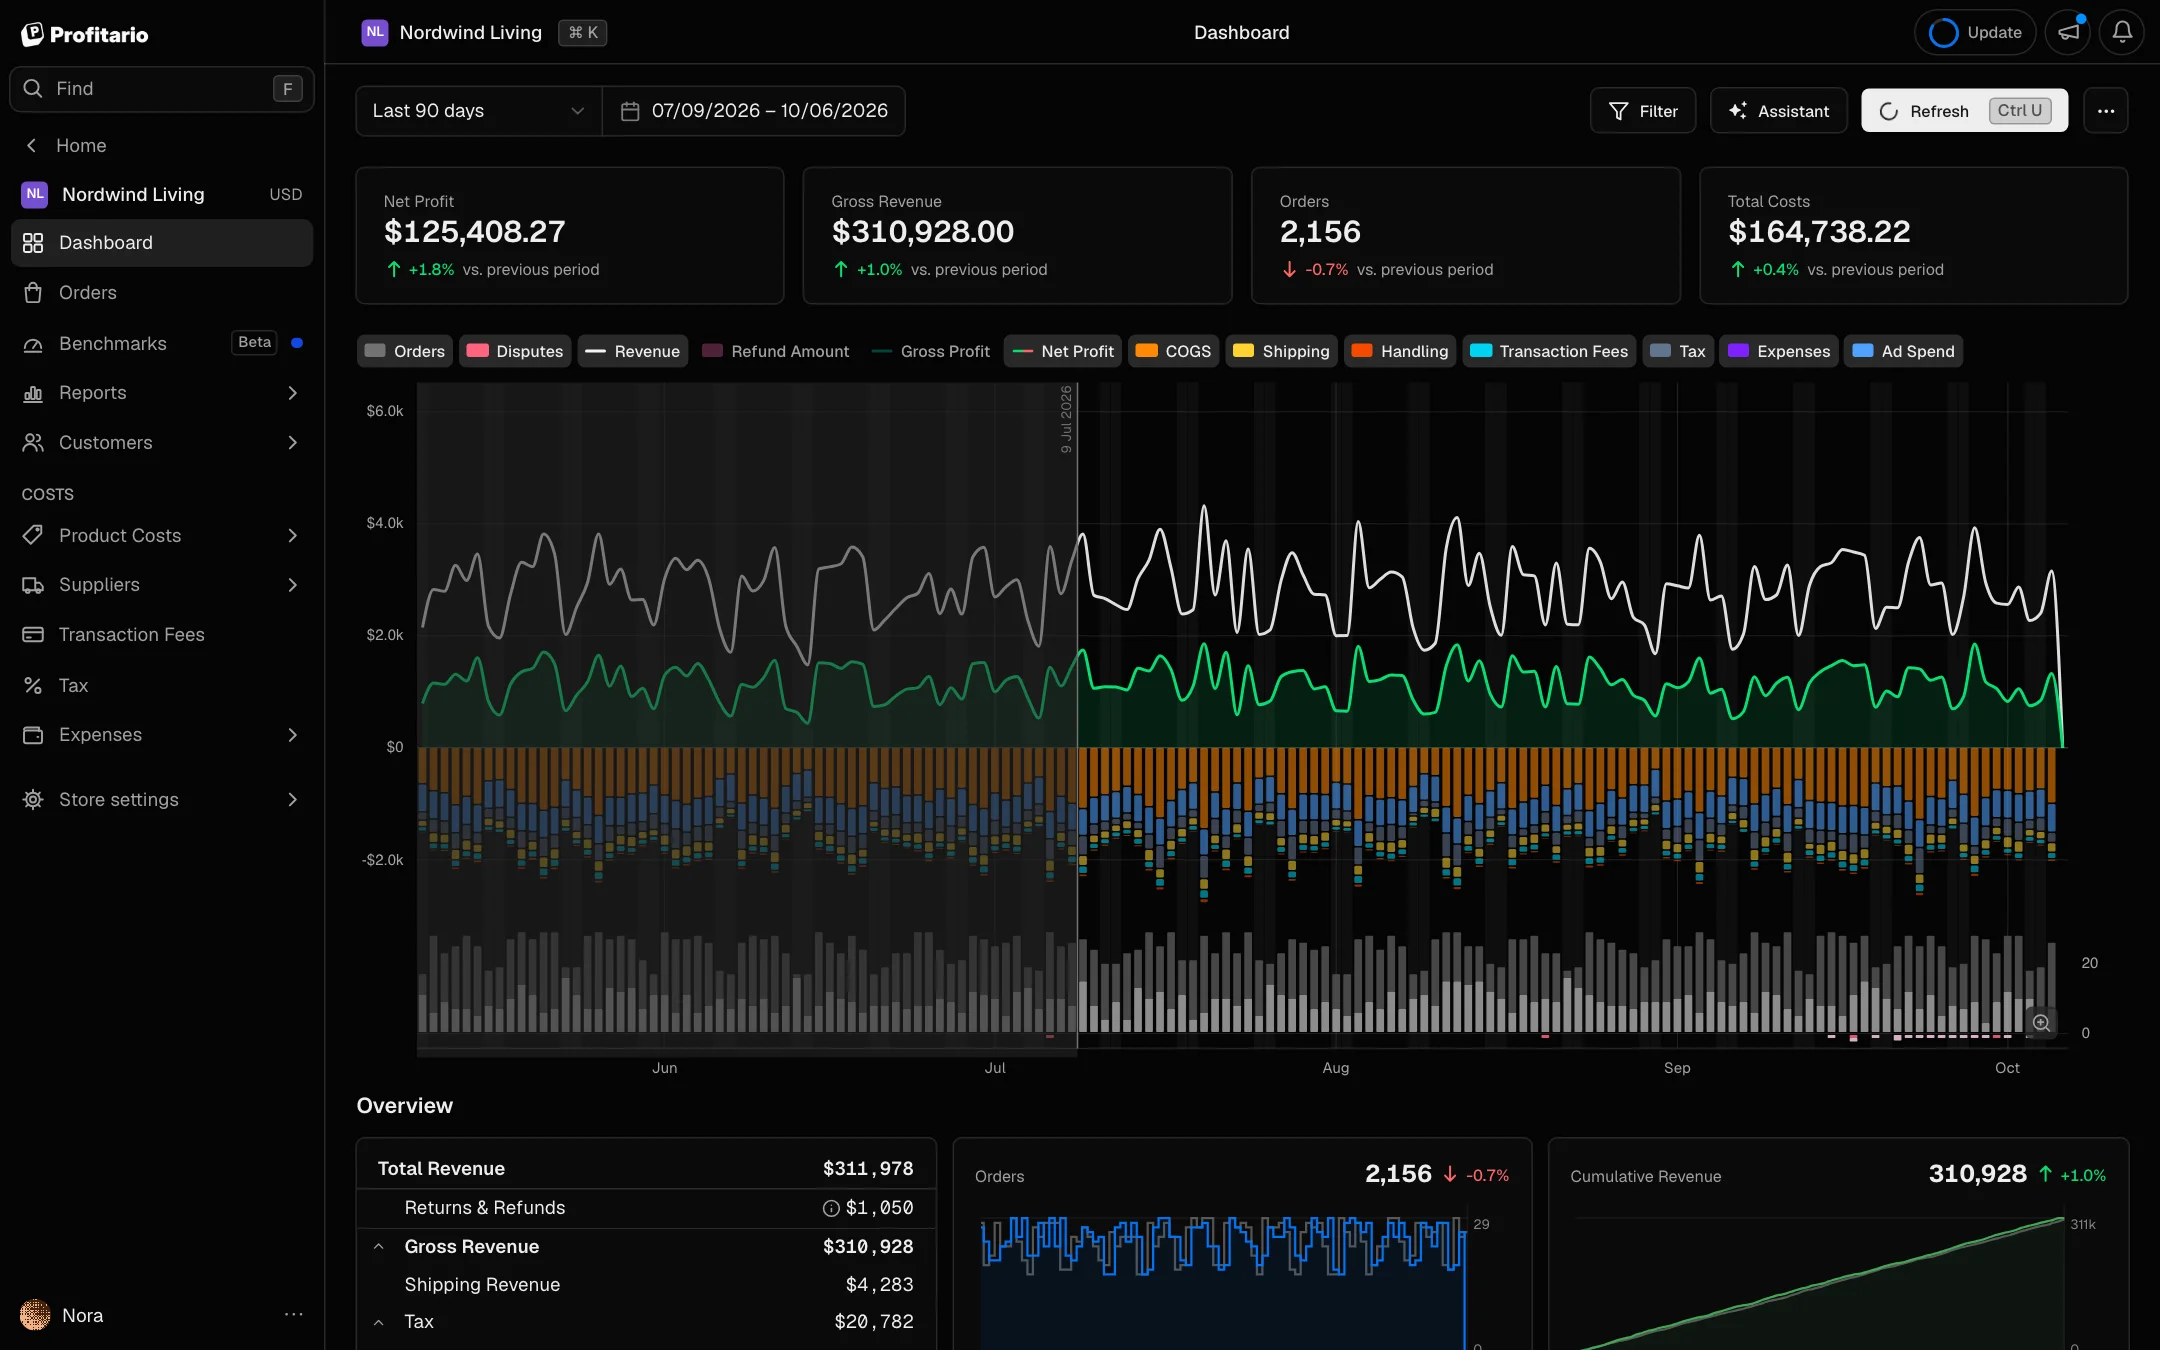
Revenue minus product costs, shipping, fees, ad spend, taxes and expenses, counted on the day each order was placed. Updated as orders come in.

Sample data
Your real profit, every day

How it helps

A Shopify profit dashboard that counts every cost, not just sales

Shopify reports sales, but sales are not profit. The Profitario Shopify profit dashboard subtracts product costs, shipping, transaction fees, ad spend, taxes and your own expenses, so store owners see what each day actually earned.

  1. 01

    Net profit without spreadsheets

    Costs come in from Shopify, your ad accounts, payment providers and suppliers, and the rest you add once as rules. It works as a Shopify net profit tracker: net profit and profit margin every day, without a monthly spreadsheet to rebuild.

  2. 02

    Costs you can act on

    Every cost type has its own line with its change against the previous period, like an ecommerce profit and loss dashboard you never have to build. When margin drops, you see whether shipping, ad spend or refunds moved, and fix that cost first.

  3. 03

    Decisions on the right day

    Daily profit tracking counts each order on the day it was placed, with ad spend on the same day. Net profit after ad spend shows a weak week while you can still react.

Features

What the report shows

Loading 0%

Calculating profit0%
Net profit

Last 30 days

$12,48014%
$0k
$20k
$40k
$60k
$48.2k$12.5k
RevenueCOGSAd spendShippingFeesExpensesProfit

Profit after every cost

Gross revenue at the top, net profit at the bottom, and every cost in between as its own line. Open any line to see what it is made of.

Comparing periods0%
Net profit

Daily · vs previous 14 days

$12,48014%
$0
$200
$400
$600
$800
Sep 6Sep 9Sep 12Sep 15Sep 18
Net profitPrevious period

Trends next to the last period

Revenue, profit, margin, ROAS, AOV and refunds by day, week or month, with the previous period behind it. Hover a day for the full numbers.

Splitting costs0%
Cost breakdown

Last 30 days

8%

$35.7k

Total costs

  • COGS$18.2k51%
  • Ad spend$10.4k29%
  • Shipping$4.1k11%
  • Fees$1.9k5%
  • Expenses$1.1k4%

Where the money goes

Total costs split into COGS, ads, shipping, fees, taxes and your own categories, each with its change against the previous period.

Filling the heatmap0%
Revenue heatmap

Daily revenue · last 18 weeks

$214.6k11%
MWFS
LessMore

Every day at a glance

Revenue and ad spend heatmaps show strong and weak days at a glance, next to a daily table with every cost and the net profit.

Running the example store0%

Net profit per day by ad spend

Every cost counted

$1.5k
$1k
$500
$0
-$500
Break-even · ROAS 1.9×
$1,105 a day · ROAS 3.1×
+$315 a day
Revenue still rises, profit falls
$200$600$900$1,200$1,600 a day
  1. 01 · MeasureKnow your break-even ROAS1.9×
  2. 02 · PushRaise spend while profit still rises+$315
  3. 03 · HoldStop where the next dollar costs profit$900 a day

With every cost counted, this store needs a 1.9× ROAS for ad spend to break even. Above that, ads add profit.

In the report: Break-even ROAS and CPA tiles

Grow on profit, not on revenue

Example: a home goods store spending $600 a day on ads.

Questions it answers

From a question to the next step

  1. 01 · You ask

    Did I make money yesterday?

    Why it matters: Revenue can rise while profit falls. A daily net profit number catches a losing day before it turns into a losing month.

    The report shows

    Net profit for the day after product costs, shipping, fees, ads and expenses.

    You act

    If the day closed below zero, open the breakdown and find the cost that pushed it under.

    Daily profit

    Daily table · last 5 days

    DayRevenueCostsNet profit
    • Oct 5
      $6,410
      $5,126
      $1,284
    • Oct 4
      $5,880
      $4,972
      $908
    • Oct 3
      $4,120
      $4,365
      -$245
    • Oct 2
      $6,050
      $4,890
      $1,160
    • Oct 1
      $5,310
      $4,402
      $908
    5 days
    $27,770
    $23,755
    $4,015
  2. 02 · You ask

    What is eating my margin this month?

    Why it matters: Margin rarely disappears at once. A cost that grows a few percent faster than revenue each month adds up to a large share of profit over a year.

    The report shows

    Every cost with its change against last month, next to revenue growth.

    You act

    Work on the cost that grew faster than revenue first. Here: compare carriers before touching the ad budget.

    Cost changes

    September vs August · revenue +4%

    ChangeAmount
    • ShippingAbove revenue

      Was $4,100

      +18%
    • Ad spendAbove revenue

      Was $10,360

      +6%
    • Fees

      Was $1,890

      +3%
    • COGS

      Was $18,240

      +2%
  3. 03 · You ask

    How much does an average order leave me?

    Why it matters: If the average order sits close to break-even, any discount or shipping increase turns it into a loss. Knowing the gap tells you how much room you have.

    The report shows

    Costs per order split by type, and the order value where you break even.

    You act

    If your average order sits close to break-even, raise the order value with bundles or a free-shipping threshold.

    Average order

    September · 1,284 orders

    Break-even $51.30
    • Average basket× 1.6$64.80
    • Product costCOGS-$24.60
    • Ad spendMeta + Google-$13.90
    • ShippingLabels-$7.20
    • ExpensesFixed-$3.20
    • FeesGateway-$2.40
    • Net profit21% margin$13.50
  4. 04 · You ask

    Are refunds getting worse?

    Why it matters: Refunds take back revenue that already looked like profit. A rising refund rate is often the first sign of a product or fulfillment problem.

    The report shows

    Refund rate next to the previous period, with restocked product costs counted back.

    You act

    If refunds rise, check which products are behind the increase in the Products report.

    Refund rate

    Weekly · vs the previous 8 weeks

    3.8%0.9 pts
    0.0%
    1.0%
    2.0%
    3.0%
    4.0%
    5.0%
    W33W35W37W39
    Refund ratePrevious period

Common questions

Questions about the Profit Dashboard report

Shopify reports sales and, with product costs set, gross profit. It does not subtract ad spend, app subscriptions or your other expenses. Profitario imports those costs and shows net profit per day on the Profit Dashboard.

Start tracking your real profit today

No credit card required. Free plan available forever.

We value your privacy
We use cookies to enhance your experience. By continuing to use our site, you consent to our use of cookies.

By clicking "Accept All", you consent to our use of cookies.

Learn more