

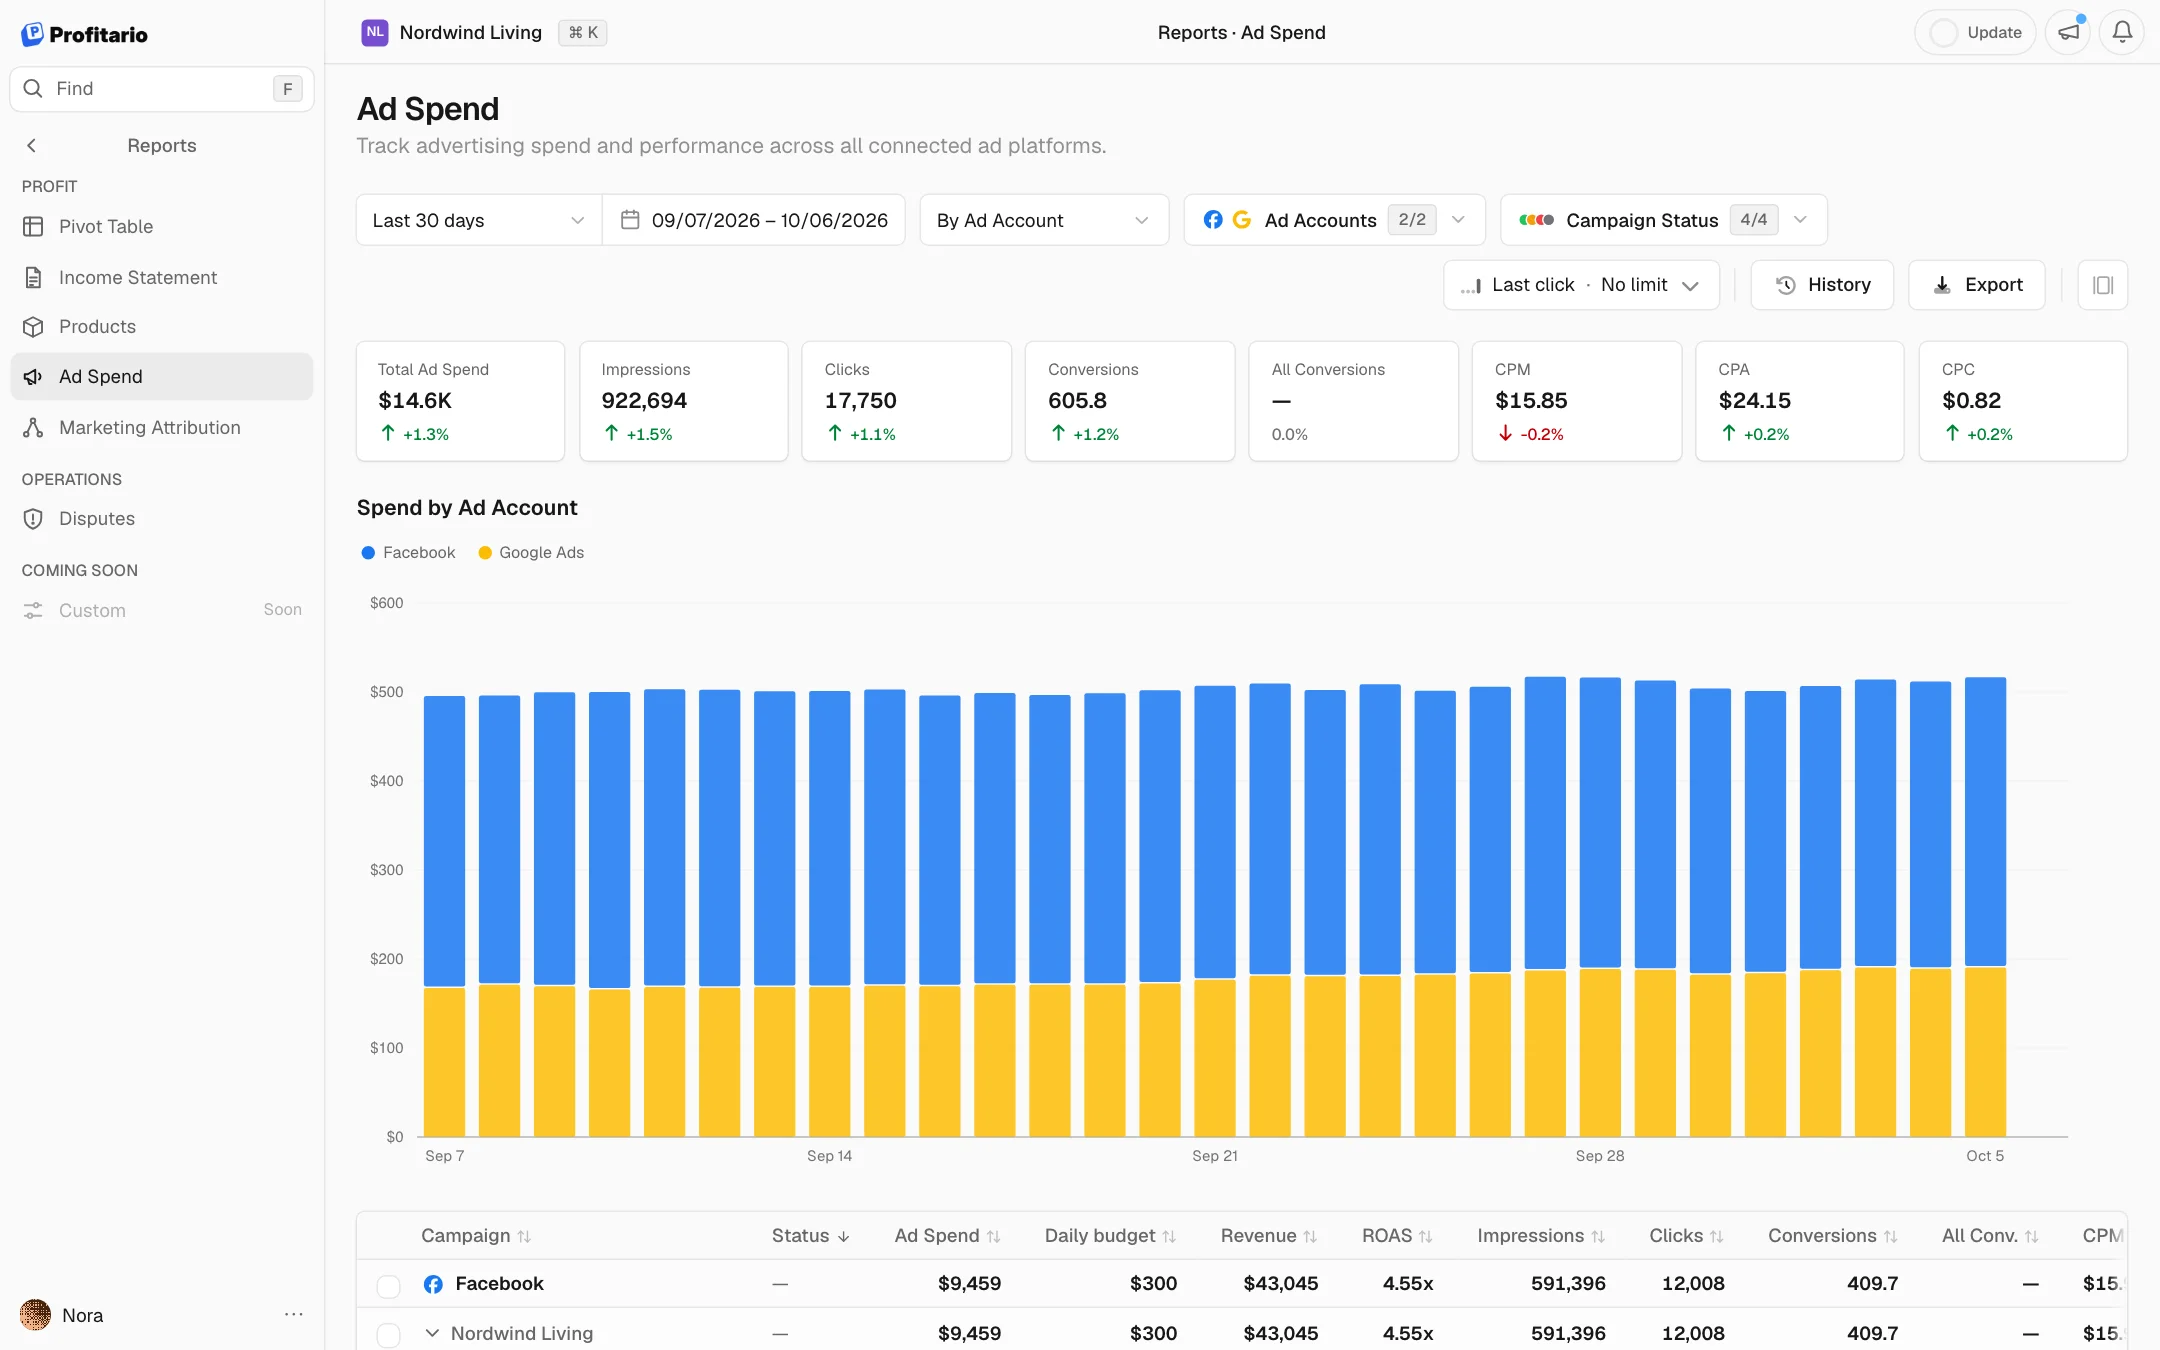
Ad Spend

See where every ad dollar goes

Spend, impressions, clicks, attributed revenue and ROAS for every platform, account and campaign in one report.

Sample data
See where every ad dollar goes

How it helps

One Shopify ad spend tracker for every ad platform

Each ad manager reports its own conversions, and their totals rarely match your store. This Shopify ad spend tracker pulls spend from every connected platform into one ad spend dashboard and credits revenue from orders matched in your store, so campaigns are compared on the same basis.

  1. 01

    One basis for every platform

    Spend, impressions, clicks, CPM, CPC and CPA come from Meta, Google, TikTok and the other platforms you connect. As a ROAS tracker for Shopify, it takes revenue from your own orders, so a campaign on one platform can be compared fairly with a campaign on another.

  2. 02

    Budget where ROAS clears break-even

    The Shopify ads report ranks campaigns by ROAS and shows CPA by campaign, so you see which ones return more than your break-even ROAS and which lose money on every order. Moving budget from the bottom of that list to the top is the quickest way to raise profit without raising spend.

  3. 03

    Budgets and scaling in view

    Daily budgets are drawn as a line next to actual spend, and every cost metric carries its change against the previous period. When you raise budgets, you see whether CPA stayed steady or started to climb.

Features

What the report shows

Loading 0%

Syncing Meta, Google, TikTok0%
Ad spend

Spend by platform · last 8 days

$5,8809%
$0
$250
$500
$750
$1,000
Sep 12Sep 13Sep 14Sep 15Sep 16Sep 17Sep 18Sep 19
MetaGoogleTikTok

All platforms together

Meta, Google, TikTok and more in one place, with daily spend stacked by platform and campaign.

Matching campaigns to orders0%
Campaigns

Last 30 days · attributed in your store

SpendROAS
  • Prospecting · BroadActive

    Meta · Main Store Ads

    $887
  • Shopping · AllActive

    Google · Search & Shopping

    $820
  • Retargeting · 30dActive

    Meta · Retargeting

    $591
  • Brand SearchPaused

    Google · Search & Shopping

    $410

Campaign by campaign

Spend, CPM, CPC, CPA, attributed revenue and ROAS per platform, account and campaign.

Reading daily budgets0%
Spend vs budget

Meta · Main Store Ads

$1,875
$0
$100
$200
$300
$400
Sep 12Sep 13Sep 14Sep 15Sep 16Sep 17Sep 18Sep 19
SpendDaily budget

Budget against spend

Daily budgets drawn as a line next to actual spend, so you see where budgets were not spent or were raised.

Crediting revenue0%
Revenue by model

Credited revenue · last 30 days

First touchLast touch
  • Prospecting · Broad
    $14,200
    $5,300
  • Retargeting · 30d
    $4,200
    $7,600
  • Brand Search
    $3,100
    $9,800
First touchLast touch

First or last touch

Switch between first and last touch and every revenue and ROAS figure in the report updates.

Running the example store0%

Budget per campaign

Ranked by ROAS, break-even at 1.9×

CampaignBudget a dayROAS
Brand Search
$40-$0
5.2×
Retargeting · 30d
$60-$0
4.1×
Catalog Sales
$120-$0
3.4×
Shopping · All
$90-$0
2.8×
Lookalike 2%
$80-$0
2.0×
Prospecting · Video
$60-$0
1.5×
Broad US
$70-$0
1.2×

Spend a day

$520

Blended ROAS

2.8×

Above break-even

5 of 7

  1. 01 · RankRank campaigns by what they return5 of 7
  2. 02 · ShiftShift budget before adding more3.0×
  3. 03 · ScaleScale the campaigns that hold$520 → $650

5 of 7 campaigns return more than the 1.9× break-even ROAS, judged on revenue matched to orders in the store.

In the report: ROAS per campaign

Spend more where it pays back

Example: 7 campaigns spending $520 a day on Meta, Google and TikTok.

Questions it answers

From a question to the next step

  1. 01 · You ask

    Which campaigns deserve more budget?

    Why it matters: Without a shared basis, budget goes to the platform that reports the most conversions, not to the campaign that brings the most orders.

    The report shows

    Campaigns ranked by ROAS from orders matched in your store.

    You act

    Move budget from campaigns under your break-even ROAS to the ones above it, and watch CPA as you raise.

    Campaigns

    Last 30 days · break-even ROAS 1.9×

    CampaignSpendROASCPA
    • Shopping · All
      $2,210
      2.9×
      $24.60
    • Lookalike 2%
      $1,740
      2.6×
      $27.40
    • Retargeting DE
      $1,480
      4.1×
      $18.20
    • Broad US
      $1,400
      0.8×
      $82.30
    • Prospecting · Broad
      $887
      1.1×
      $58.10
    5 campaigns
    $7,717
    2.3×
    $31.40
  2. 02 · You ask

    Which campaigns spend without bringing orders?

    Why it matters: A campaign that spends without matched orders costs money every day it runs. Spotting it after a week instead of after a month is a direct saving.

    The report shows

    Spend next to credited orders per campaign.

    You act

    Pause or rebuild campaigns that spend without matched orders, or check their tracking first.

    Spend vs orders

    Last 30 days · orders matched in your store

    • Video AwarenessNo orders

      0 orders in 9 days

      $1,240
    • Catalog Sales$27.70 CPA

      31 orders

      $860
    • Rooms · Pinterest$305 CPA

      2 orders

      $610
    • Brand Search$9.30 CPA

      44 orders

      $410
  3. 03 · You ask

    What happened when I raised budgets?

    Why it matters: Scaling budgets usually raises CPA. If you do not watch it, a campaign can slide below break-even while revenue still looks fine.

    The report shows

    CPM, CPC and CPA with their change against the previous period.

    You act

    If CPA climbs faster than budget, the audience is saturating. Test new creatives before raising further.

    Daily budget40%

    $0

    CPM9%

    $0.00

    CPC14%

    $0.00

    CPA28%

    $0.00

  4. 04 · You ask

    Which campaigns start journeys, and which close them?

    Why it matters: Some campaigns start journeys that other campaigns close. Judging everything on last touch alone can switch off the campaigns that feed the rest.

    The report shows

    Revenue per campaign under first touch and under last touch.

    You act

    Keep the campaigns that start journeys funded, even when last touch credits them little.

    Who opened, who closed

    Order #13180 · credit by model

    First touchLast touch
    1. Prospecting · Broad

      Meta Ads · 9 days before

      Credited · $14.10
    2. Retargeting · 30d

      Meta Ads · 3 days before

    3. Brand Search

      Google Ads · 1 hour before

    4. Order #13180

      2 items · paid Oct 4

      $412.00

Common questions

Questions about the Ad Spend report

A good ROAS is one above your break-even ROAS, which depends on your margin. With a 50% margin before ads you break even at 2.0x; with 25% you need 4.0x. Set targets above break-even to leave room for refunds and overhead.

Start tracking your real profit today

No credit card required. Free plan available forever.

We value your privacy
We use cookies to enhance your experience. By continuing to use our site, you consent to our use of cookies.

By clicking "Accept All", you consent to our use of cookies.

Learn more