

Lifetime Value

What a customer is worth over time

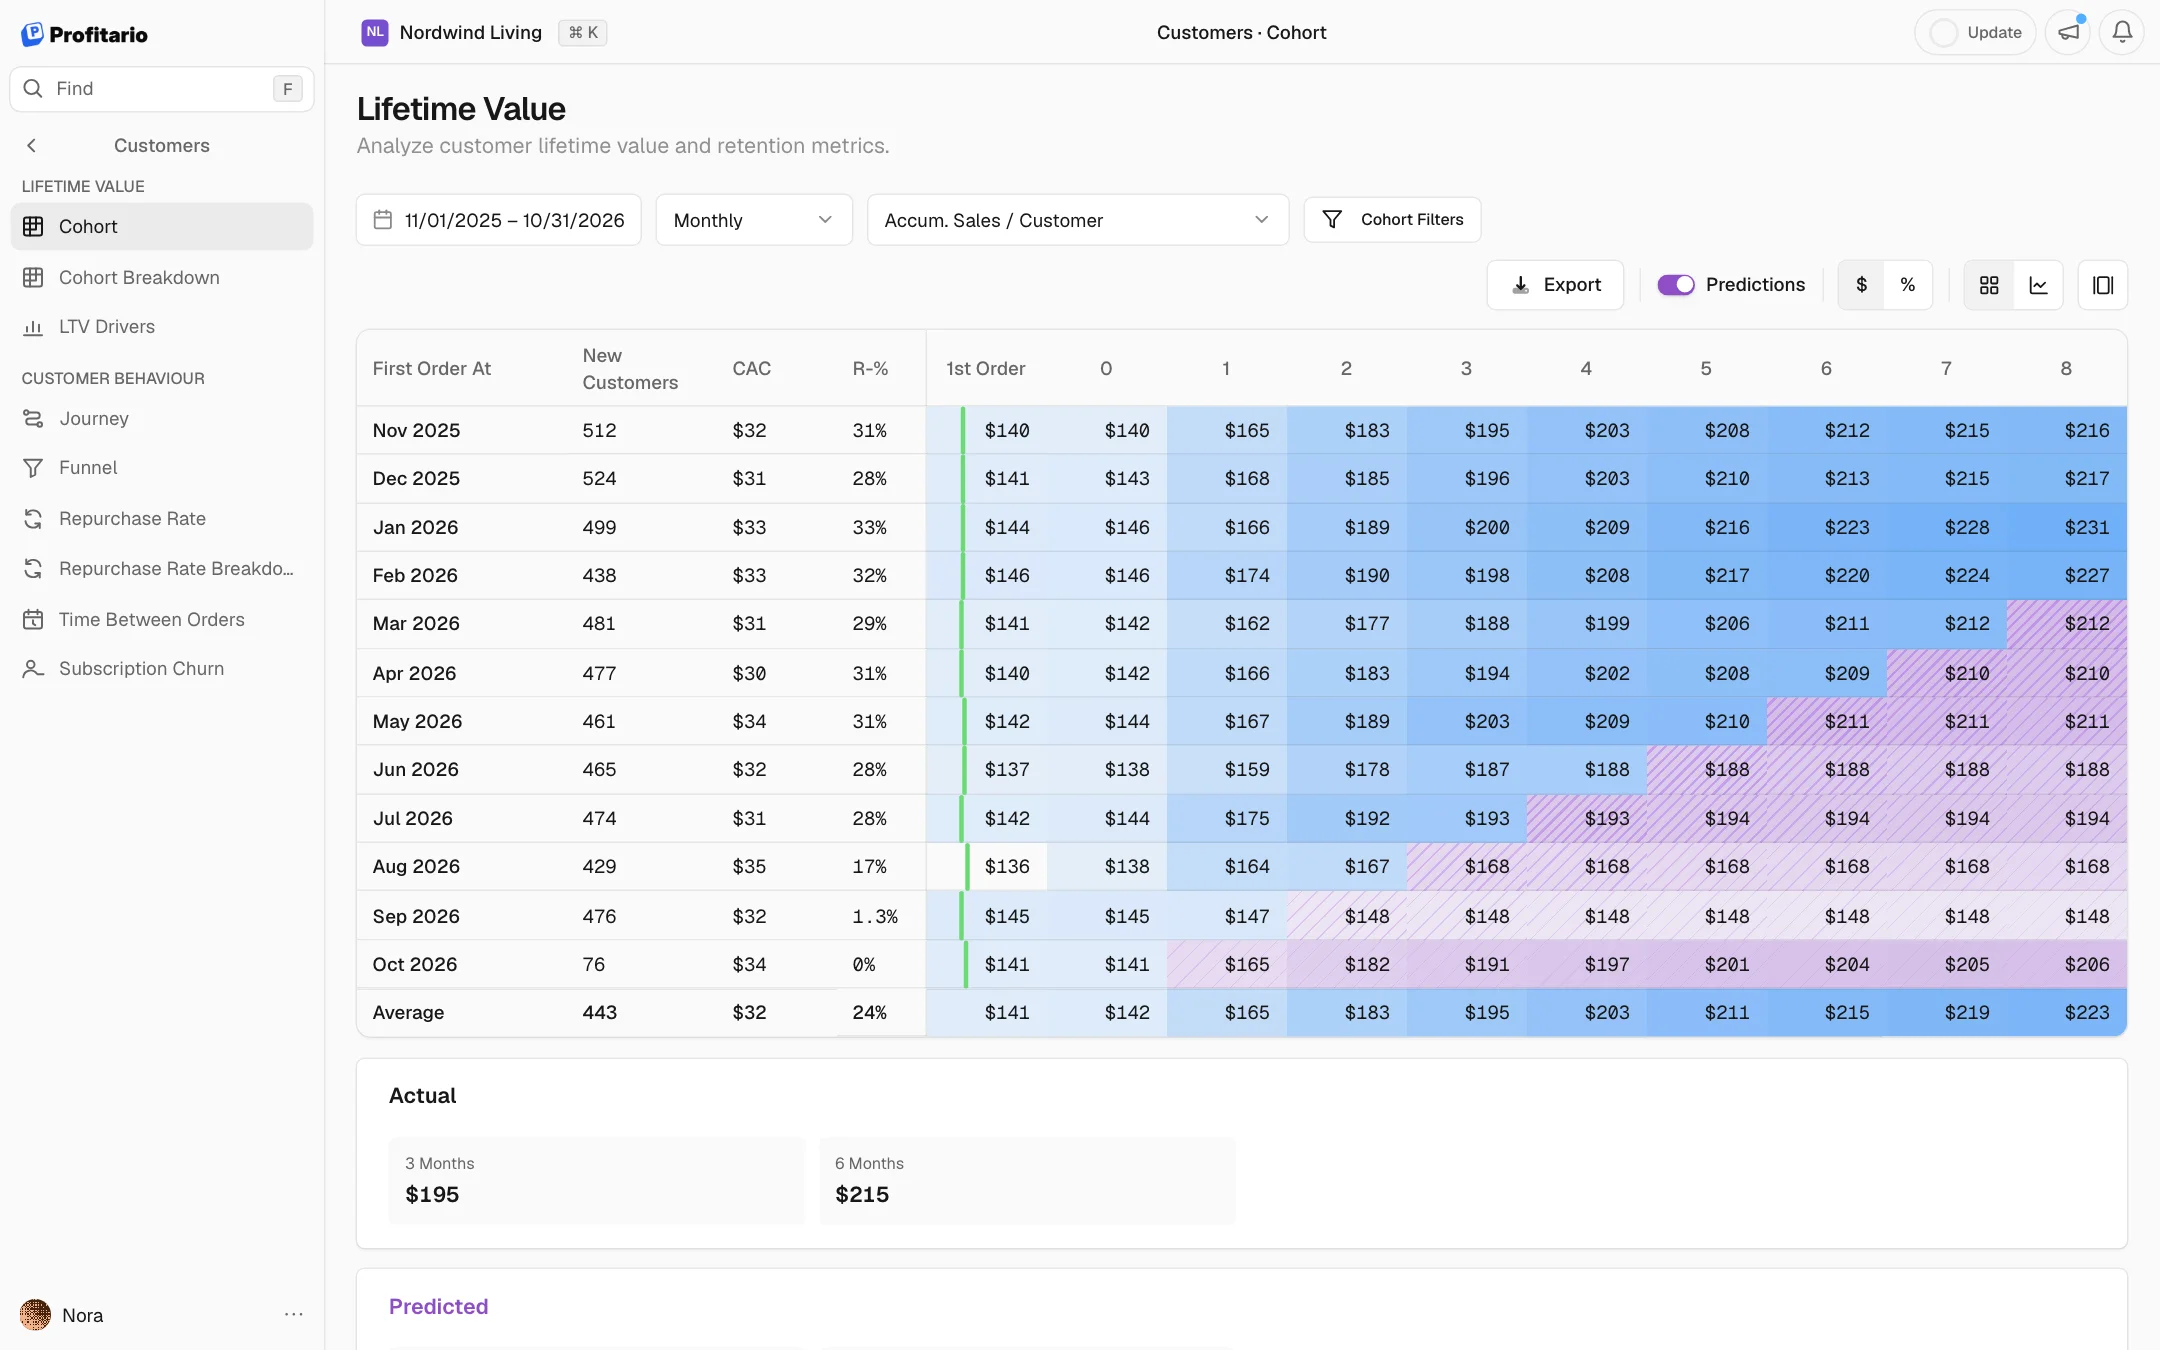
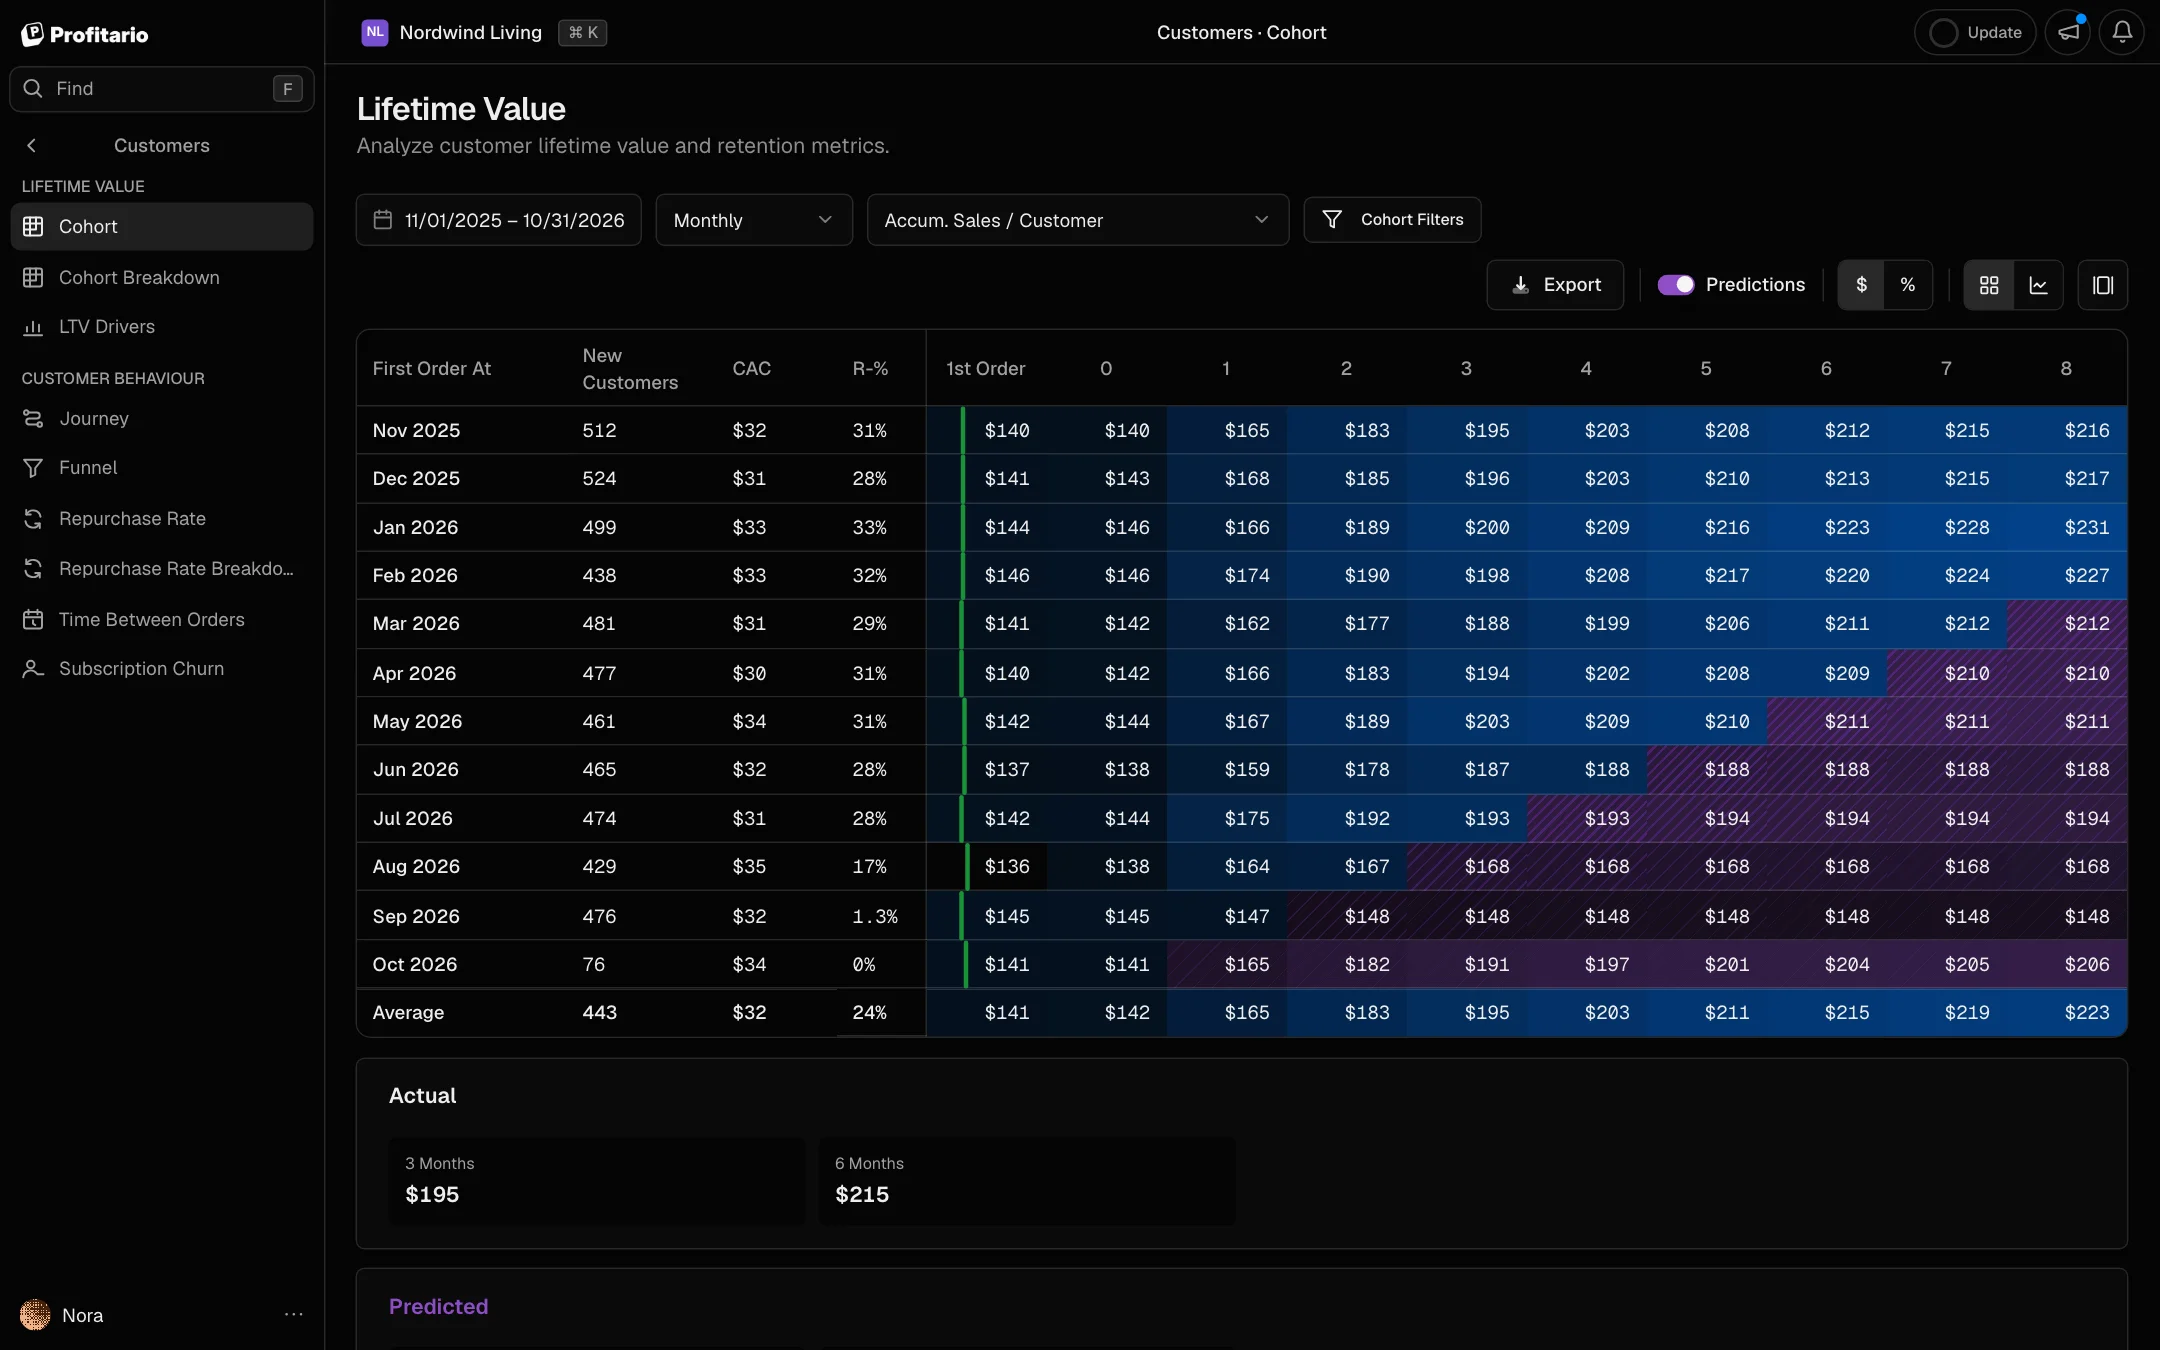
Customers grouped by the month they first bought, with revenue, margin and retention tracked month by month.

Sample data
What a customer is worth over time

How it helps

Shopify customer lifetime value you can set a budget on

A first Shopify order rarely pays for the ad that brought it. The Lifetime Value report shows customer lifetime value in margin over the months after, so you know how much you can spend to win one and how long it takes to get that money back.

  1. 01

    Margin, not just revenue

    Every cohort is measured as margin-based LTV, after product costs, shipping and fees, the money that actually pays back acquisition. A cohort that looks strong on revenue but thin on margin shows up as it is.

  2. 02

    Payback in months

    Cumulative margin per customer is set against the cohort acquisition cost, so the month where a cohort breaks even is visible. That turns a vague LTV into a cash question: can you fund the gap until payback.

  3. 03

    The sources of good customers

    Cohort breakdowns and LTV drivers compare customers by first product, channel, country and discount code. You can point ads and offers at the entry points that bring customers who come back, and away from the ones that do not.

Features

What the report shows

Loading 0%

Grouping cohorts0%
Cohorts

Cumulative revenue per customer

M0M1M2M3M4M5
Apr$42$53$64$75$86$97
May$40$51$62$73$84
Jun$38$49$60$71
Jul$36$47$58
Aug$34$45
Sep$32
Months since first orderLowHigh

Cohort grid

Each row is an acquisition month, each column a month later. Switch between revenue, margin and retention per customer.

Adding up margin0%
CAC payback

Cumulative margin per customer vs CAC

Month 41 month
$0
$20
$40
$60
$80
CAC $49
Paid back
M0M2M4M6
Margin per customer

CAC payback

Cumulative margin per customer against the cohort's acquisition cost, and how much is left before payback.

Splitting by product0%
Cohort breakdown

Cumulative revenue per customer by first product

$0
$50
$100
$150
$200
M0M1M2M3M4M5
  • Coffee set$163
  • Towels$132
  • Mug set$111
  • Gift card$92

Cohort breakdown

Split cohorts by first product, channel, country or discount code to compare how they develop.

Ranking first products0%
LTV drivers

Lifetime value vs store average ($118)

  • Coffee Starter Set+38%

    640 customers

    $163
  • Towel Bundle+12%

    410 customers

    $132
  • Mug Set-6%

    260 customers

    $111
  • Gift Card-22%

    180 customers

    $92

LTV drivers

The first products, sources and codes that bring customers with higher lifetime value, as lift against your average.

Running the example store0%

Margin per customer

Cumulative, by month since the first order

$120
$80
$40
$0
CAC $38
Paid back in month 4
New starter set customers a month
Before640
At $58860
Month 036912
  1. 01 · MeasureKnow when a customer pays backMonth 4
  2. 02 · RaiseBid more where customers are worth more$58
  3. 03 · WinWin more of them640 → 860

The average customer covers the $38 it cost to acquire them in month 4.

In the report: Payback against acquisition cost

Spend more to win customers who stay

Example: customers acquired for $38 each.

Questions it answers

From a question to the next step

  1. 01 · You ask

    How long until a new customer pays back?

    Why it matters: Payback time decides how much you can spend on acquisition without running out of cash. A shop that knows it earns its customer acquisition cost back in four months can bid higher than one that only counts the first order.

    The report shows

    Cumulative margin per customer against the cohort's CAC.

    You act

    Knowing payback takes four months lets you spend more on acquisition than the first order covers, as long as you have the cash for the gap.

    Payback

    Cumulative margin per customer vs CAC

    Month 41 month
    $0
    $20
    $40
    $60
    $80
    M1M2M3M4M5M6M7M8
    Margin per customerCAC $49
  2. 02 · You ask

    Which first product brings the best customers?

    Why it matters: Customers who start with the right product often stay for years. Leading with that product in ads raises lifetime value without spending more per click.

    The report shows

    LTV lift per first product against the store average.

    You act

    Lead your ads with the first products that bring the most valuable customers.

    Where the best customers start

    Lifetime value by first product

    +38%
    $0
    $50
    $100
    $150
    $200
    Coffee setTowelsMug setGift card
    LTVStore average $118
  3. 03 · You ask

    Are my recent customers worth less?

    Why it matters: Falling value in new cohorts is an early warning that shows months before total revenue moves. Comparing customer retention by cohort at the same age keeps seasonality and growth out of the picture.

    The report shows

    Recent cohorts next to older ones at the same age.

    You act

    If recent cohorts trail older ones at the same age, check what changed: offer, channel or product mix.

    Recent vs older cohort

    Revenue per customer at the same age

    $5818%
    $0
    $20
    $40
    $60
    $80
    Month 0Month 1Month 2Month 3
    Jun cohortJan cohort
  4. 04 · You ask

    Do discount customers come back?

    Why it matters: Discounts can bring customers who only buy once. Repurchase and LTV per code show whether a promotion builds a customer base or just moves margin to the shopper.

    The report shows

    Repurchase rate and LTV per discount code.

    You act

    If discount customers rarely come back, cap the discount or only show it to returning visitors.

    Customers by discount code

    Repurchase in 180 days and LTV

    RepurchaseLTV
    • No code

      1,840 customers

      34%
    • FREESHIP

      420 customers

      29%
    • SUMMER15

      310 customers

      22%
    • WELCOME20-43% LTV

      960 customers

      17%

Common questions

Questions about the Lifetime Value report

Lifetime value is the total a customer brings over time, usually counted as revenue or margin per customer. Profitario groups customers by the month of their first order and adds up revenue and margin per customer month by month, so you see LTV at 1, 3, 6 or 12 months instead of a single average.

Start tracking your real profit today

No credit card required. Free plan available forever.

We value your privacy
We use cookies to enhance your experience. By continuing to use our site, you consent to our use of cookies.

By clicking "Accept All", you consent to our use of cookies.

Learn more