

Income Statement

A full income statement, built from your orders

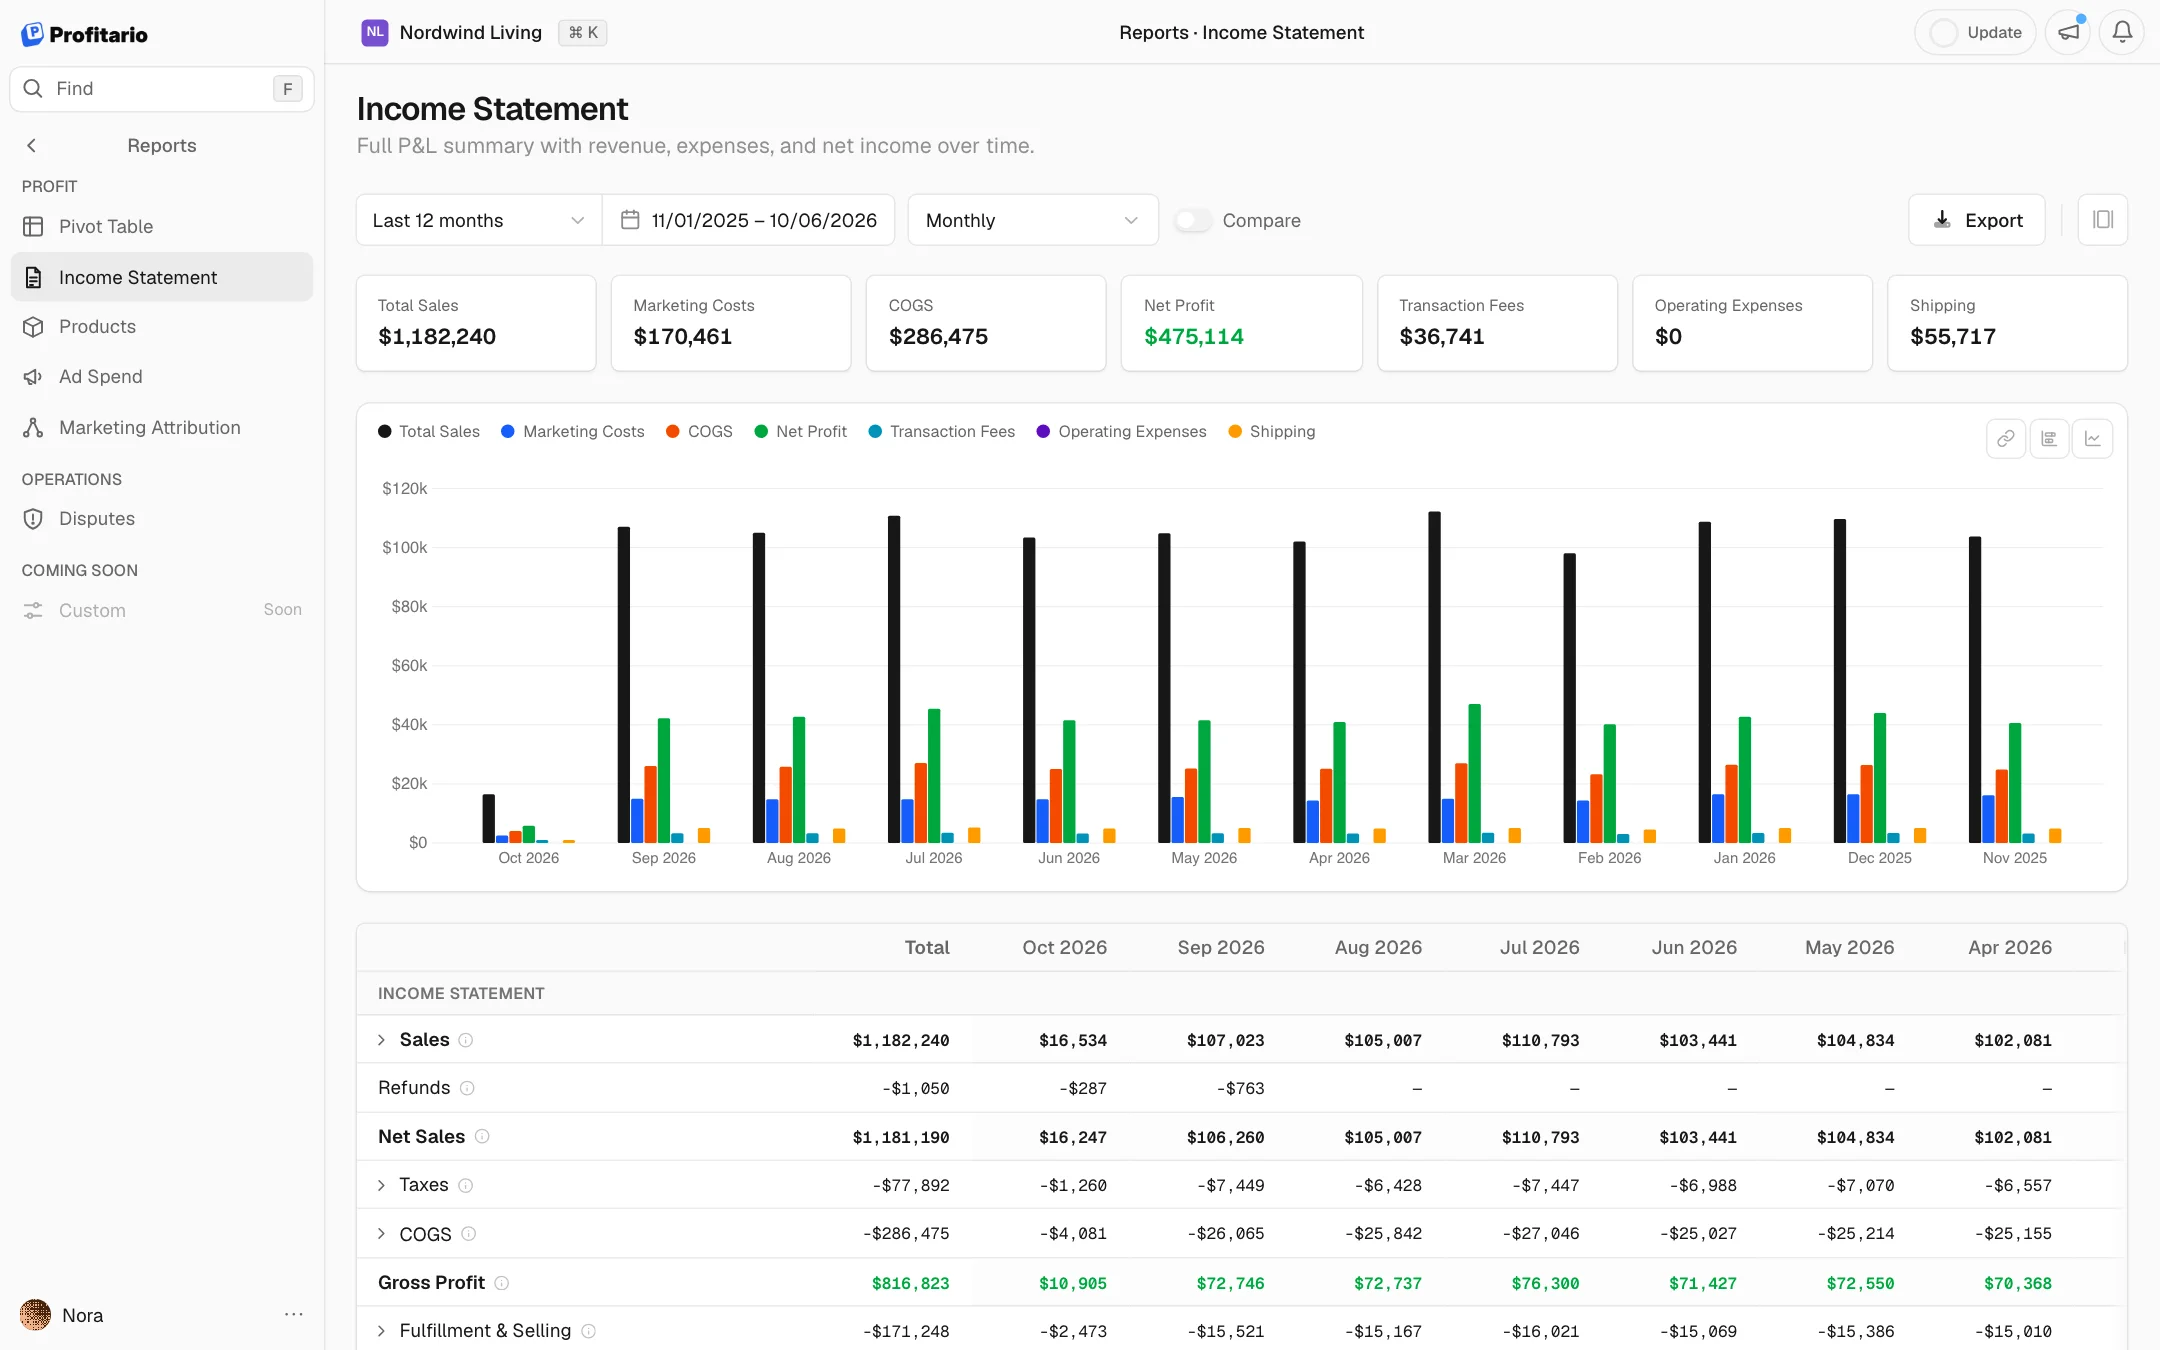
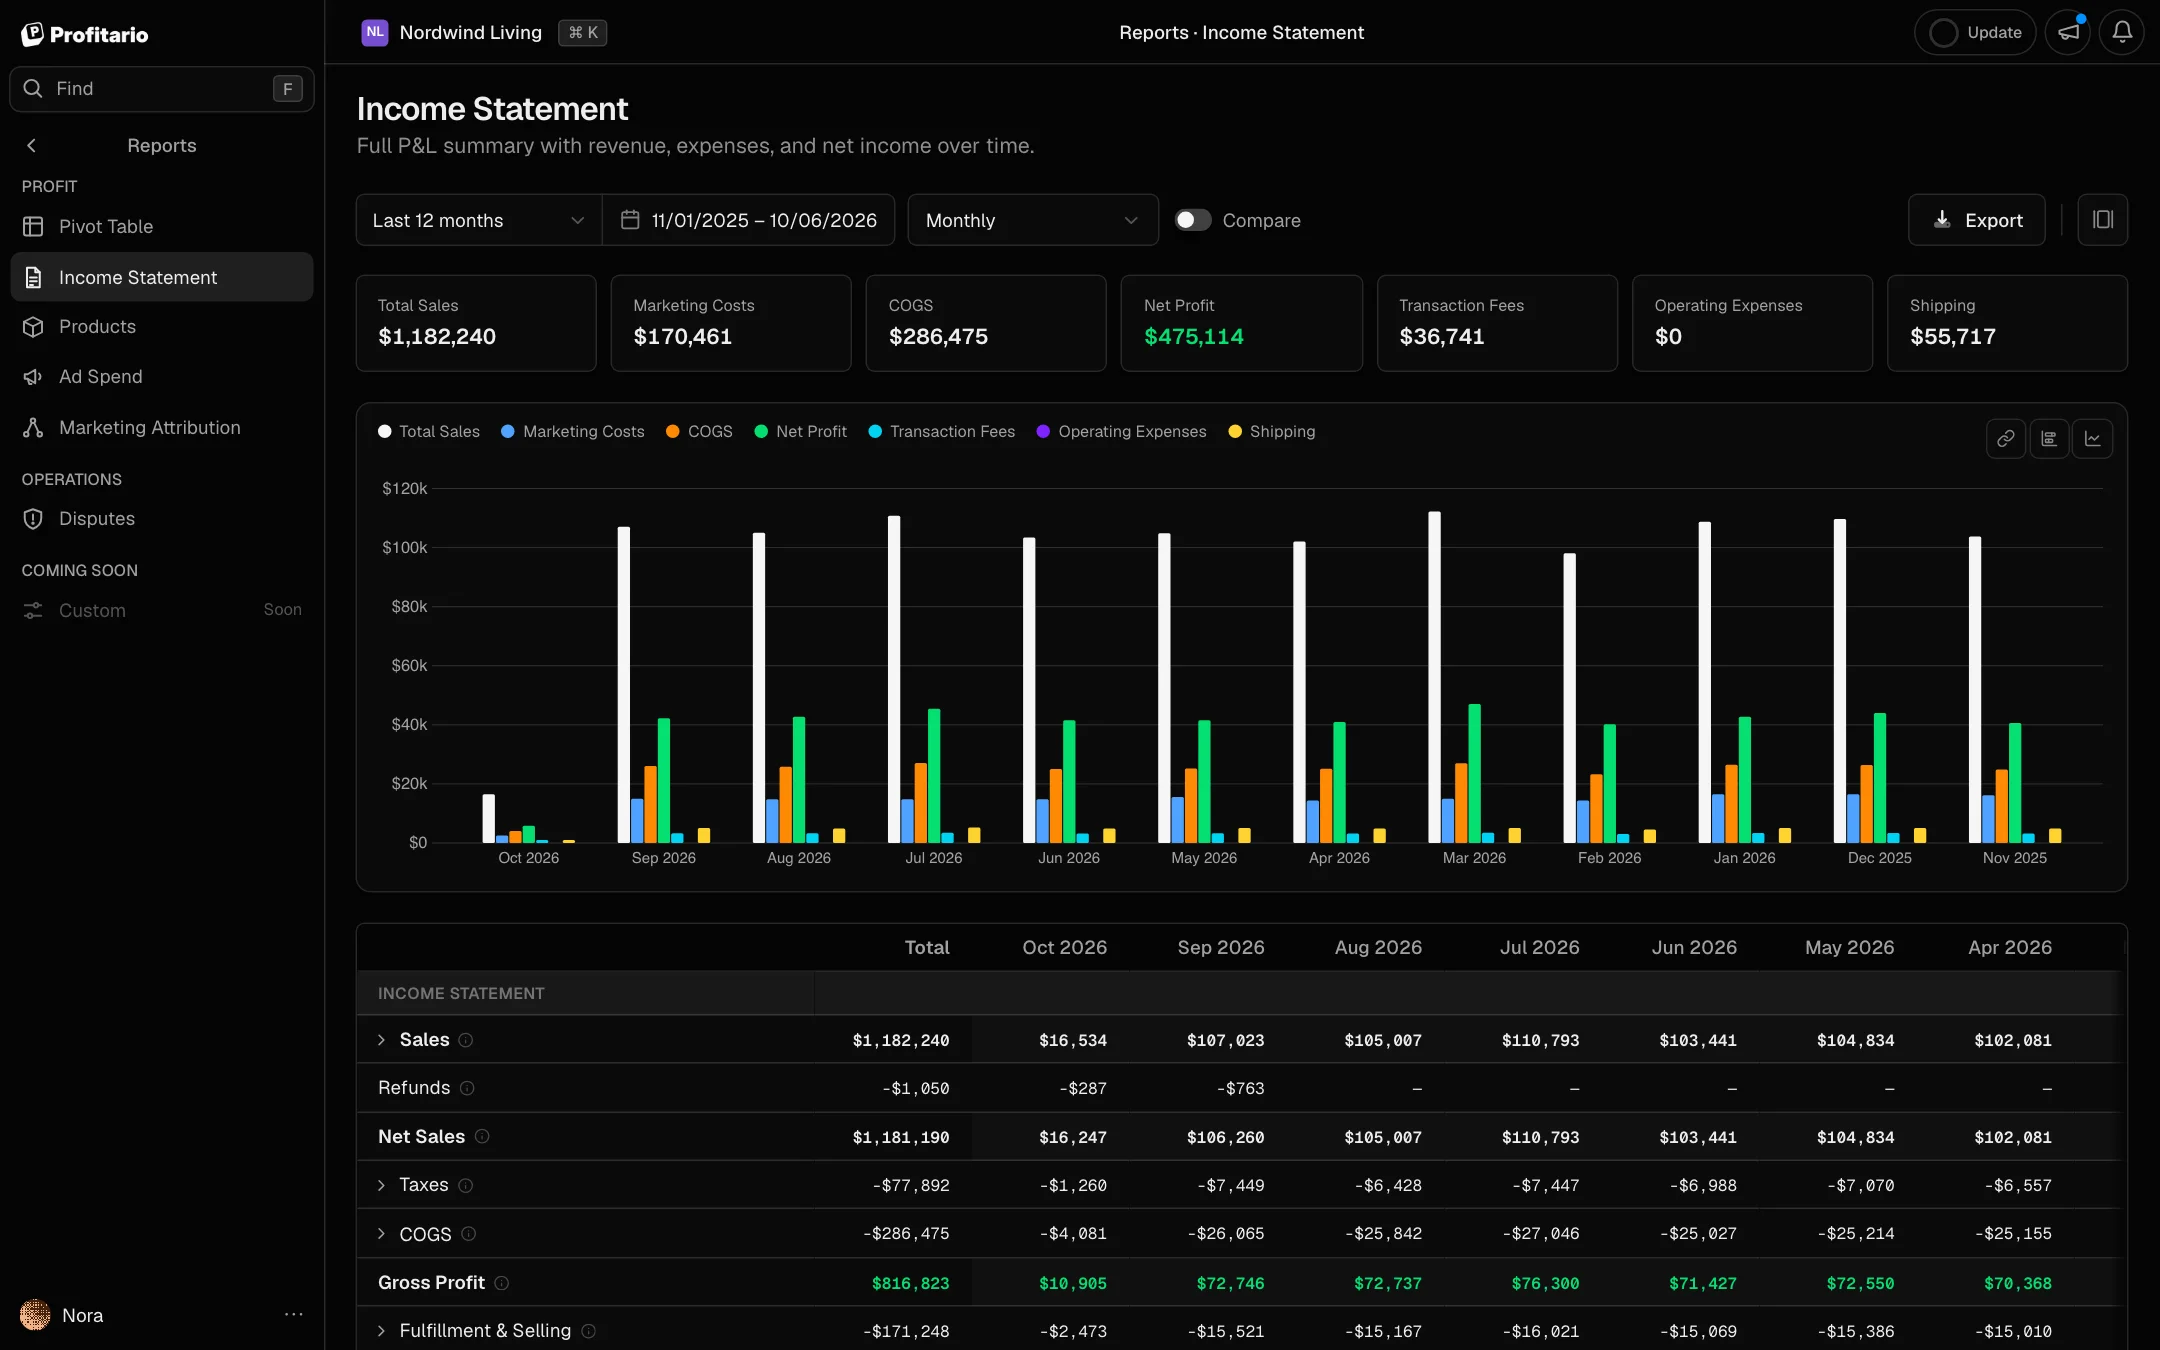
Revenue down to net profit in accounting order, by period, with margins, acquisition metrics and period comparison.

Sample data
A full income statement, built from your orders

How it helps

A Shopify profit and loss statement that builds itself

Shopify reports show sales, but not what is left after product costs, shipping, fees, ads and overhead. This Shopify profit and loss statement puts every one of those lines in accounting order, an ecommerce income statement that store owners and their accountants can read without a spreadsheet.

  1. 01

    Contribution margin before fixed costs

    Variable costs come off first: product costs, shipping, transaction fees and ad spend. What remains is the contribution margin of your Shopify store, the money each period of sales adds toward fixed costs and profit. When it is thin, you know growth alone will not fix the bottom line.

  2. 02

    Growth you can compare

    Every line sits next to the previous period with the change in amount and percent. If revenue grew 20% and net profit 3%, the cost ratio that grew with it is one row away, so you can act on the cause instead of the headline.

  3. 03

    Acquisition cost in the same statement

    CAC (ad spend per new Shopify customer), ROAS, new and returning customers and AOV sit below the profit lines. You see in one place whether new customers pay back on their first order or depend on repeat purchases, which decides how hard you can push ad spend.

Features

What the report shows

Loading 0%

Building the statement0%
Income statement

September · accounting order

$9,01021%
  • Revenue$52,040
  • Refunds-$3,840
  • Net sales$48,200
  • COGS-$19,100
    • Shopify costs-$11,920
    • Supplier invoices-$7,180
  • Gross profit60%$29,100
  • Variable costs-$11,100
  • Contribution37%$18,000
  • Operating expenses-$8,990
  • Net profit19%$9,010

Accounting structure

Revenue, net sales, gross profit, contribution margin and net profit, line by line, with every line expandable.

Comparing to August0%
Period over period

September vs August

+14%
$0k
$10k
$20k
$30k
$40k
$50k
Net salesGross profitContributionNet profit
SeptemberAugust

Period over period

Every line next to the previous period, with the change in amount and percent.

Calculating margins0%
Margins

Contribution margin by month

24%5 pts
0%
10%
20%
30%
Target 25%
FebAprJunAug
Contribution margin

Margins and ratios

Gross, contribution and net margin, each cost as a share of revenue, and the dispute rate.

Counting new customers0%
CAC4.2%

$0.00

ROAS0.3

0.0×

AOV2.1%

$0.00

Returning1.8 pts

0%

Acquisition and orders

CAC, ROAS, new and returning customers, AOV and items per order in the same statement.

Running the example store0%

Monthly profit by revenue

Contribution margin against fixed costs

$60k
$40k
$20k
$0
Fixed costs $28k a month
Contribution margin 24%
Break-even $117k
Shipping +3 pts: -$4.5k a month at $150k
$150k: $8.0k profit
$60k$120k$180k$240k revenue
  1. 01 · KnowKnow your break-even revenue$117k a month
  2. 02 · WatchCatch margin drift as you grow+3 pts
  3. 03 · ScaleScale with the margin held$29.6k a month

Contribution margin covers fixed costs from $117k of revenue a month. Every dollar above that adds 24 cents of profit.

In the report: Contribution margin line

Scale with unit economics you trust

Example: $28k of fixed costs a month and a 24% contribution margin.

Questions it answers

From a question to the next step

  1. 01 · You ask

    What does each sale leave after variable costs?

    Why it matters: Revenue growth hides a thin margin. If each sale leaves little after variable costs, more ads and more orders add work but barely any profit.

    The report shows

    Contribution margin after product, shipping, fees and ads, per period.

    You act

    If contribution margin is thin, every extra sale adds little. Fix unit costs before scaling ads.

    Contribution margin

    September · after variable costs

    37%2 pts
    $0k
    $20k
    $40k
    $60k
    $48.2k$18.0k
    Net salesCOGSAd spendShippingFeesContrib.
  2. 02 · You ask

    Did profit grow as fast as revenue?

    Why it matters: Profit that lags behind revenue usually means one cost grew faster than sales. Without the comparison it shows up months later as a cash problem.

    The report shows

    Revenue and net profit growth against the previous period.

    You act

    If revenue grew and profit did not, find the cost ratio that rose with it.

    Growth since April

    Change since April

    +3%19 pts
    0%
    5%
    10%
    15%
    20%
    25%
    AprJunAug
    Net profitRevenue
  3. 03 · You ask

    What does a new customer cost me?

    Why it matters: If a new customer costs more than the margin on their first order, every acquisition is a loan that only repeat purchases pay back.

    The report shows

    Ad spend divided by new customers, per period.

    You act

    Hold CAC below the margin a customer brings in their first order, or plan for repeat purchases to cover it.

    CAC vs first-order margin

    Ad spend / new customers · monthly

    $31.4013%
    $0.00
    $10.00
    $20.00
    $30.00
    $40.00
    FebAprJunAug
    CACFirst-order margin
  4. 04 · You ask

    What does my P&L look like month by month?

    Why it matters: A month-by-month statement is what an accountant, partner or investor asks for first. Building it by hand from exports takes hours and goes stale fast.

    The report shows

    Every line per month, with a total column.

    You act

    Send the month-by-month statement to your accountant or investors instead of building one.

    Income statement

    Month by month · Q3

    LineJulAugSepQ3
    • Net sales
      $41,300
      $44,100
      $48,200
      $133,600
    • COGS
      -$16,500
      -$17,600
      -$19,100
      -$53,200
    • Ad spend
      -$6,900
      -$7,100
      -$7,400
      -$21,400
    • Ship. & fees
      -$3,300
      -$3,500
      -$3,700
      -$10,500
    • Opex
      -$8,480
      -$8,420
      -$8,990
      -$25,890
    • Net profit
      $6,120
      $7,480
      $9,010
      $22,610

Common questions

Questions about the Income Statement report

Shopify has a gross profit report based on the cost per item field, but it leaves out shipping costs, fees, ad spend and operating expenses. The Income Statement adds those lines and ends at net profit, so it works as a Shopify net profit report rather than a gross profit view.

Start tracking your real profit today

No credit card required. Free plan available forever.

We value your privacy
We use cookies to enhance your experience. By continuing to use our site, you consent to our use of cookies.

By clicking "Accept All", you consent to our use of cookies.

Learn more