

Products

Know which products make you money

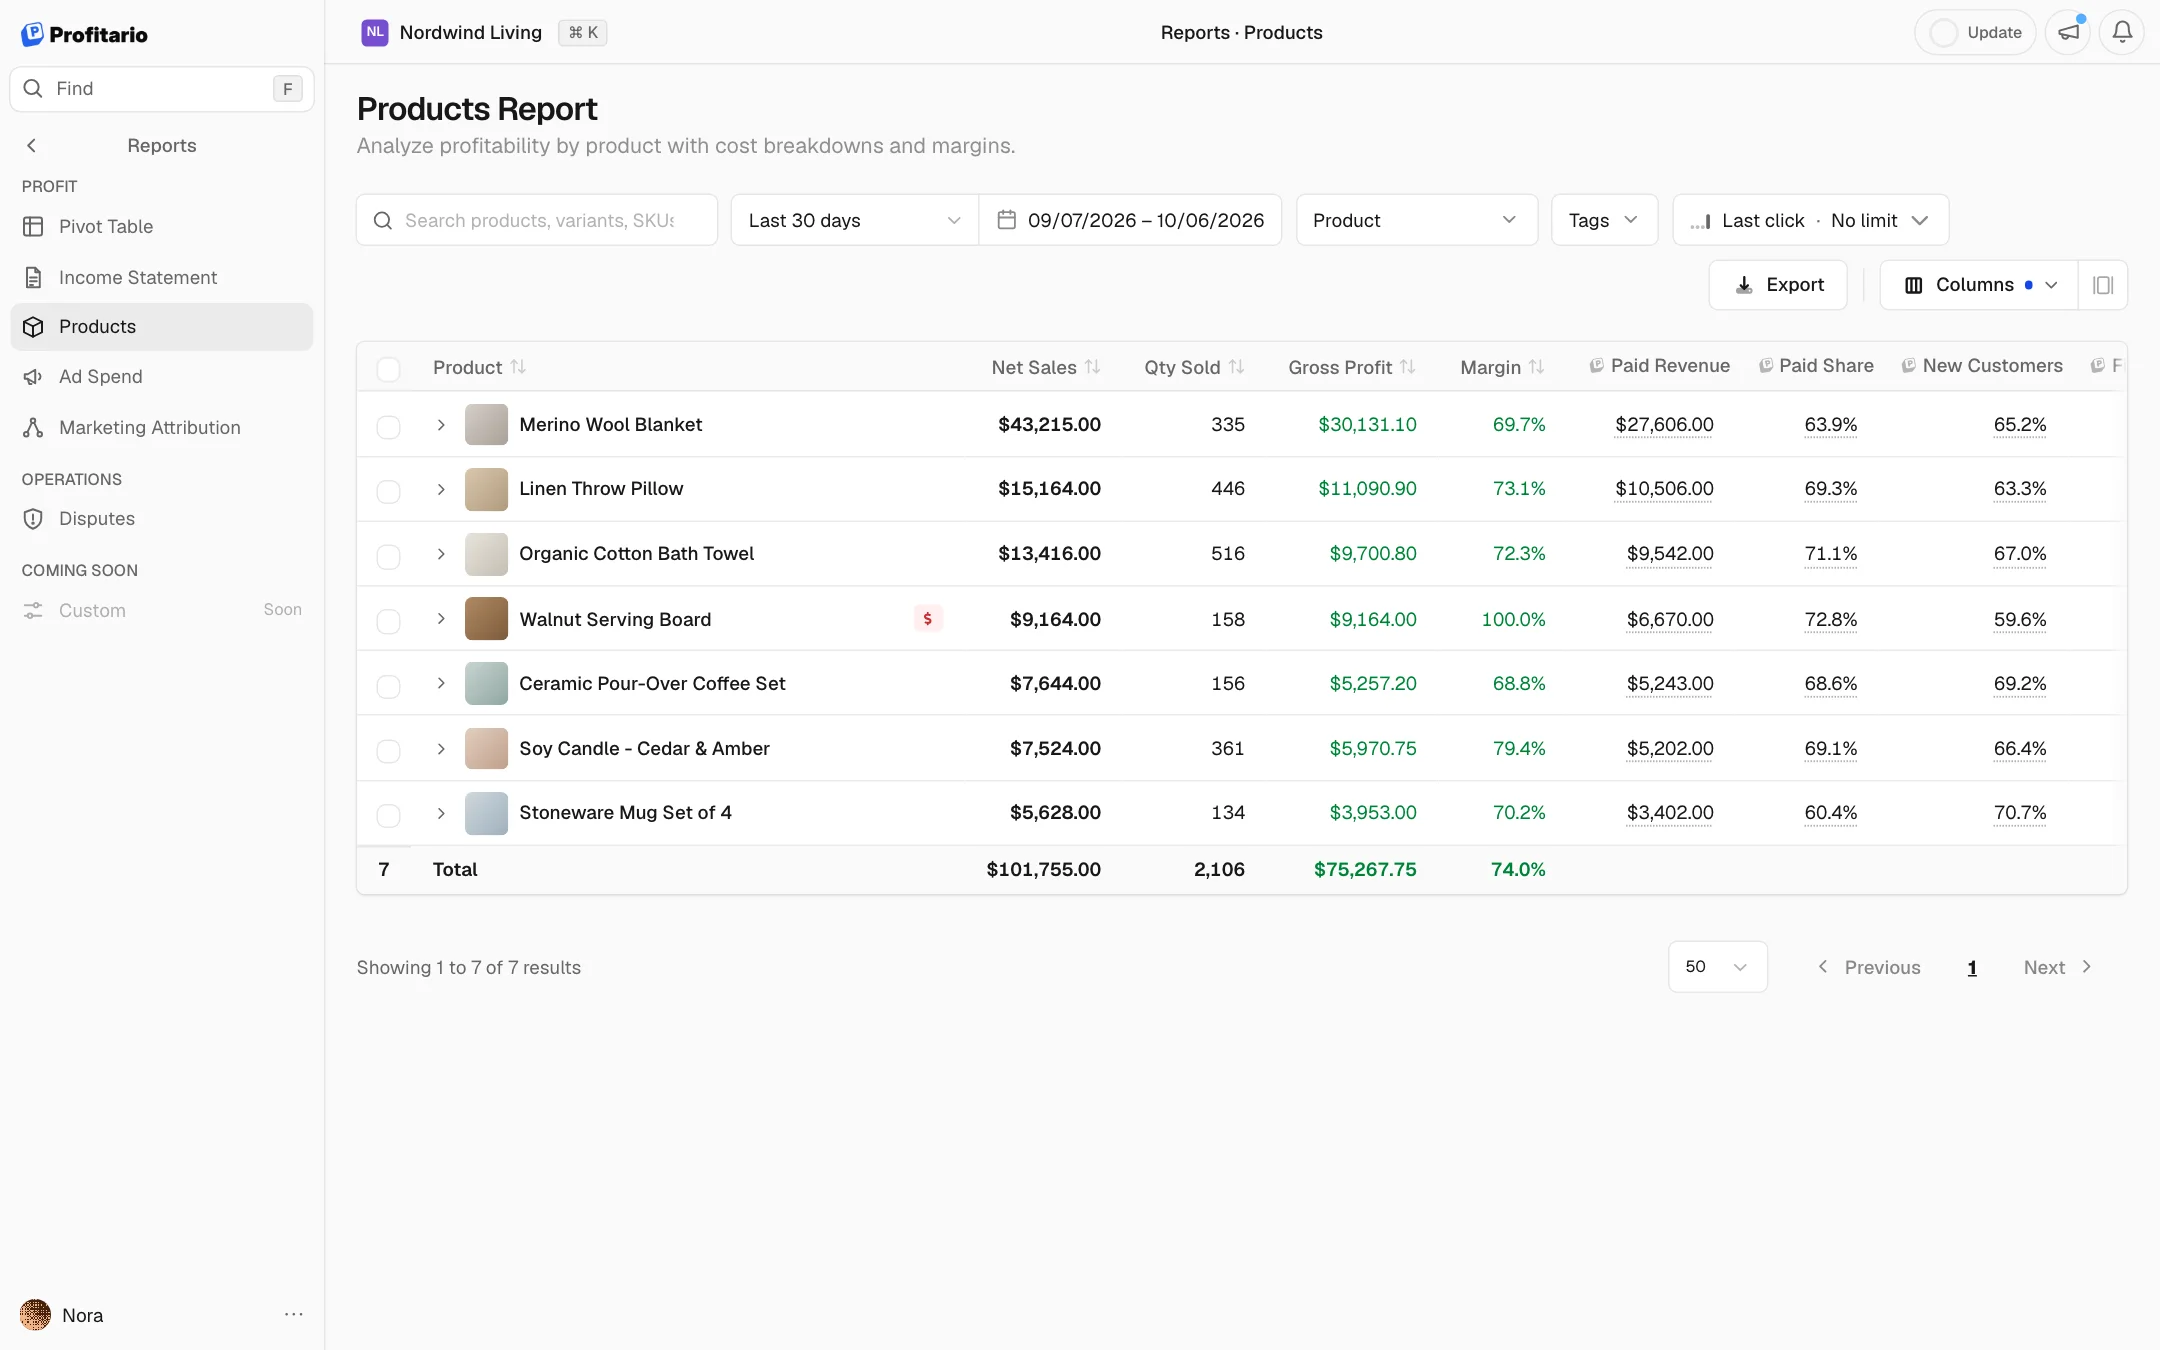
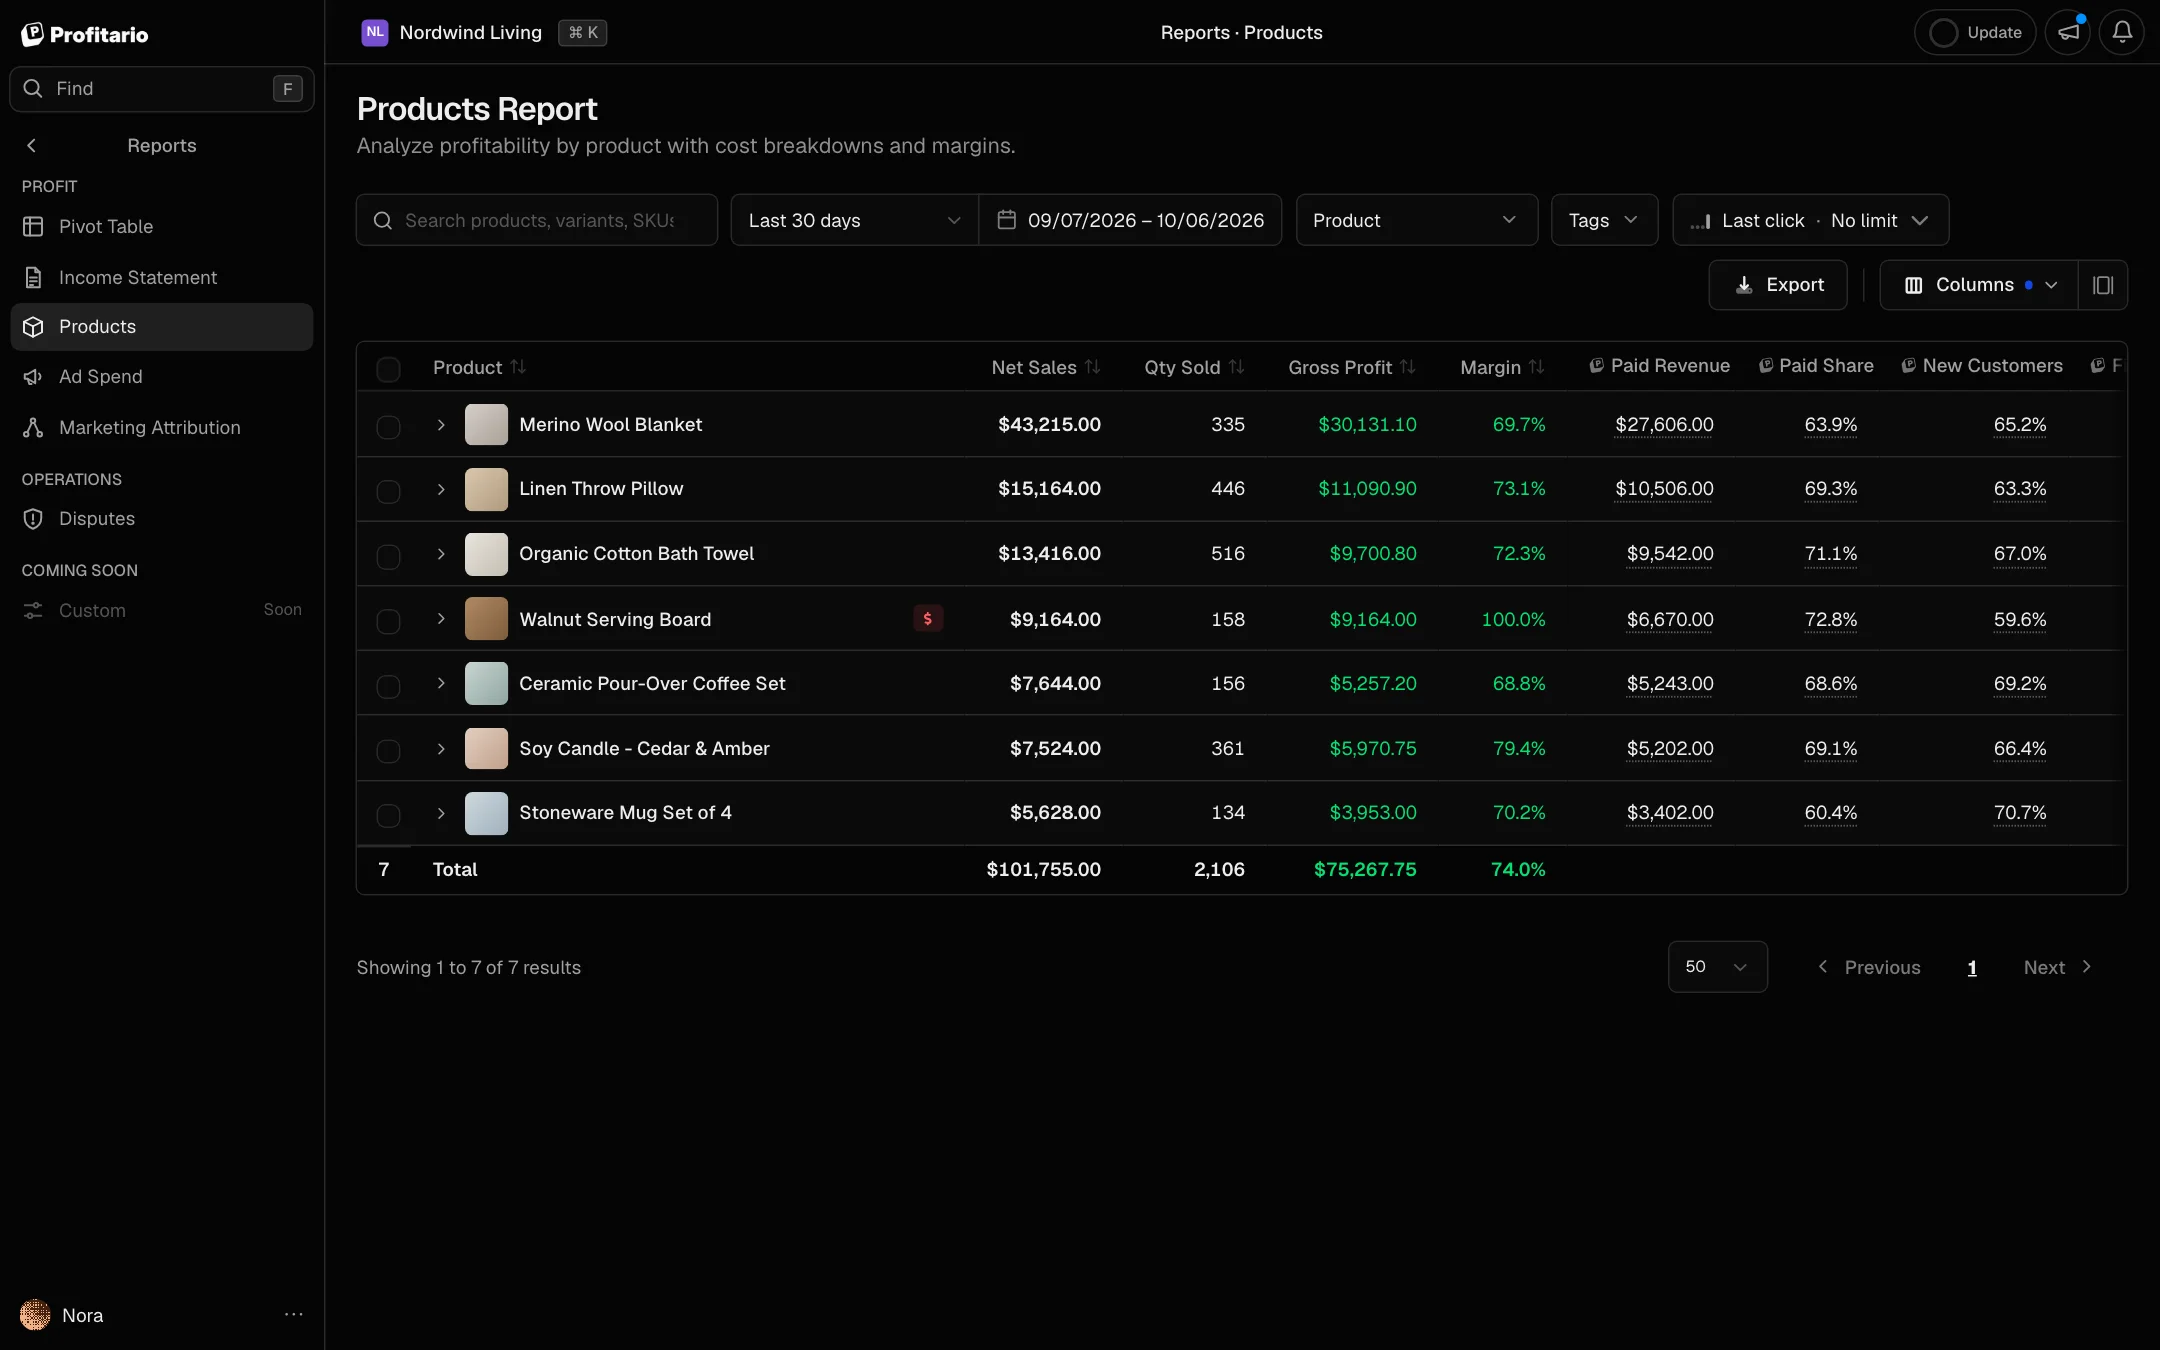
Sales, discounts, refunds, costs and margin for every product and variant, next to stock levels and sales velocity.

Sample data
Know which products make you money

How it helps

Shopify profit per product, not just sales per product

A bestseller by revenue can be a weak earner once discounts, refunds and product costs come off. The Products report shows Shopify profit per product and variant, with sales, costs, margin, returns and stock side by side, so you decide what to advertise, reprice or reorder on profit.

  1. 01

    Margin after discounts and refunds

    Gross profit and margin are calculated from net sales, after discounts and refunds, minus the product cost that applied on each order date. Sorting by profit instead of revenue shows which products carry the store and which only add volume.

  2. 02

    Returns next to sales

    Units refunded and restocked sit next to units sold, so the product return rate in your Shopify store is visible per item. A high return share points to sizing, quality or listing problems, and those are better fixed before more traffic goes to the product.

  3. 03

    Stock that matches demand

    Sales velocity over 7 and 30 days, days of stock left and inventory value show what is about to sell out and what ties up cash. You reorder the winners in time and stop buying stock that sits.

Features

What the report shows

Loading 0%

Adding up product profit0%
Products

Last 30 days

RevenueProfit
  • Standing Desk Pro44%

    121 sold

    $42.1k
  • Ergonomic Chair11%

    152 sold

    $38.0k
  • Monitor Arm52%

    96 sold

    $12.0k
  • Desk Lamp48%

    150 sold

    $6.0k

Profit per product

Net sales, product costs, gross profit and margin for every product and variant, sortable by any column.

Counting returns0%
Returns by product

Units sold and refunded

0
50
100
150
200
DeskChairArmLampMatPad
SoldRefunded

Refunds and returns

Units refunded and restocked per product next to units sold, so return-heavy items stand out.

Checking stock0%
Stock left

Standing Desk Pro · 4.1 sold / day

9 days9 days
0
50
100
150
200
Reorder at 30
Sep 19Sep 21Sep 23Sep 25Sep 27
Units in stock

Stock and velocity

Units sold per day, days of stock left and inventory value, so you see what sells out and what sits.

Loading orders0%
Orders with this product

Standing Desk Pro · 121 orders

OrderDateQtyProfit
  • #13173
    Oct 4
    1
    $191.40
  • #13167
    Oct 1
    1
    $217.87
  • #13163
    Sep 28
    2
    $399.20
  • #13171
    Sep 28
    1
    $196.63

Orders behind each product

Open a product to see every order that contains it, with the profit on each.

Running the example store0%

Products by margin and sales

Units sold per day, bubble size is stock value

60%
30%
0%
PotentialWinnersCutVolume
Linen Duvet
Desk Lamp
Towel Set
Ceramic Mug
Candle Trio
Throw Pillow
Phone Stand
Gift Wrap
Ad budget behind it: 6 → 19 a day
9 days of stock left: reorder
3 slow movers hold $8,400 of stock
0153040 a day
  1. 01 · SortSort products by what they earn2 of 8
  2. 02 · BackBack the high-margin products6 → 19
  3. 03 · ClearFree the cash in slow stock$8,400

Margin against units per day splits the range into winners, potential, volume and products to cut.

In the report: Profit and margin per product

Put money behind the products that earn it

Example: 8 products of a home goods store.

Questions it answers

From a question to the next step

  1. 01 · You ask

    Which products make me the most profit?

    Why it matters: Ad budget follows bestsellers by default. If the bestseller is not the best earner, more spend grows revenue while profit stays flat.

    The report shows

    Gross profit and margin per product and variant.

    You act

    Put ad budget behind the products that keep the most profit, not the ones that sell the most.

    Gross profit by product

    Last 30 days · top 4 products

    9%

    $31.6k

    Gross profit

    • Standing Desk Pro$18.4k58%
    • Monitor Arm$6.2k20%
    • Ergonomic Chair$4.1k13%
    • Desk Lamp$2.9k9%
  2. 02 · You ask

    Which bestseller barely makes money?

    Why it matters: A high-volume product with a thin margin takes the same stock, shipping and support as a profitable one. Small price or cost changes there move total profit the most.

    The report shows

    Revenue and margin side by side, so high volume with a thin margin stands out.

    You act

    If a bestseller barely makes money, raise its price, bundle it or renegotiate its cost.

    Ergonomic Chair · per unit

    #2 by revenue · 152 sold in 30 days

    Thin margin
    • Ergonomic Chair× 1$250.00
    • Product costSupplier-$148.00
    • ShippingRule-$38.00
    • Transaction feeGateway-$7.55
    • Ad spendMeta-$29.00
    • Net profit11% margin$27.45
  3. 03 · You ask

    When will my top products sell out?

    Why it matters: Running out of a top product stops sales and wastes the ads pointing at it. Days of stock turns that risk into a date you can plan around.

    The report shows

    Days of stock at the current sales velocity.

    You act

    Reorder before it runs out, and check lead times for the products with the fewest days left.

    Days of stock

    At the last 30 days' sales speed

    • Standing Desk ProReorder now

      36 in stock · 4.1 sold a day

      9 days
    • Monitor ArmOrder by Oct 26

      109 in stock · 3.2 a day

      34 days
    • Ergonomic Chair

      254 in stock · 5.1 a day

      50 days
    • Mouse Pad

      600 in stock · 5 a day

      120 days
  4. 04 · You ask

    Which products get returned most?

    Why it matters: Returns cost the shipping both ways, the handling and often the product. A product with a high return share can lose money even with a good headline margin.

    The report shows

    Units refunded and restocked next to units sold.

    You act

    Check the product page, sizing or quality of items with a high return share before advertising them.

    Returns by product

    Last 30 days · refunded and restocked

    ProductSoldReturnedRate
    • Desk Lamp
      150
      1
      1%
    • Standing Desk Pro
      121
      2
      2%
    • Keyboard
      96
      4
      4%
    • Mesh Office Chair
      86
      12
      14%
    4 products
    453
    19
    4.2%

Common questions

Questions about the Products report

Shopify shows gross profit per product from the cost per item field. The Products report adds refunds, discounts and costs that changed over time, and lists margin, units refunded and stock for every product and variant.

Start tracking your real profit today

No credit card required. Free plan available forever.

We value your privacy
We use cookies to enhance your experience. By continuing to use our site, you consent to our use of cookies.

By clicking "Accept All", you consent to our use of cookies.

Learn more