

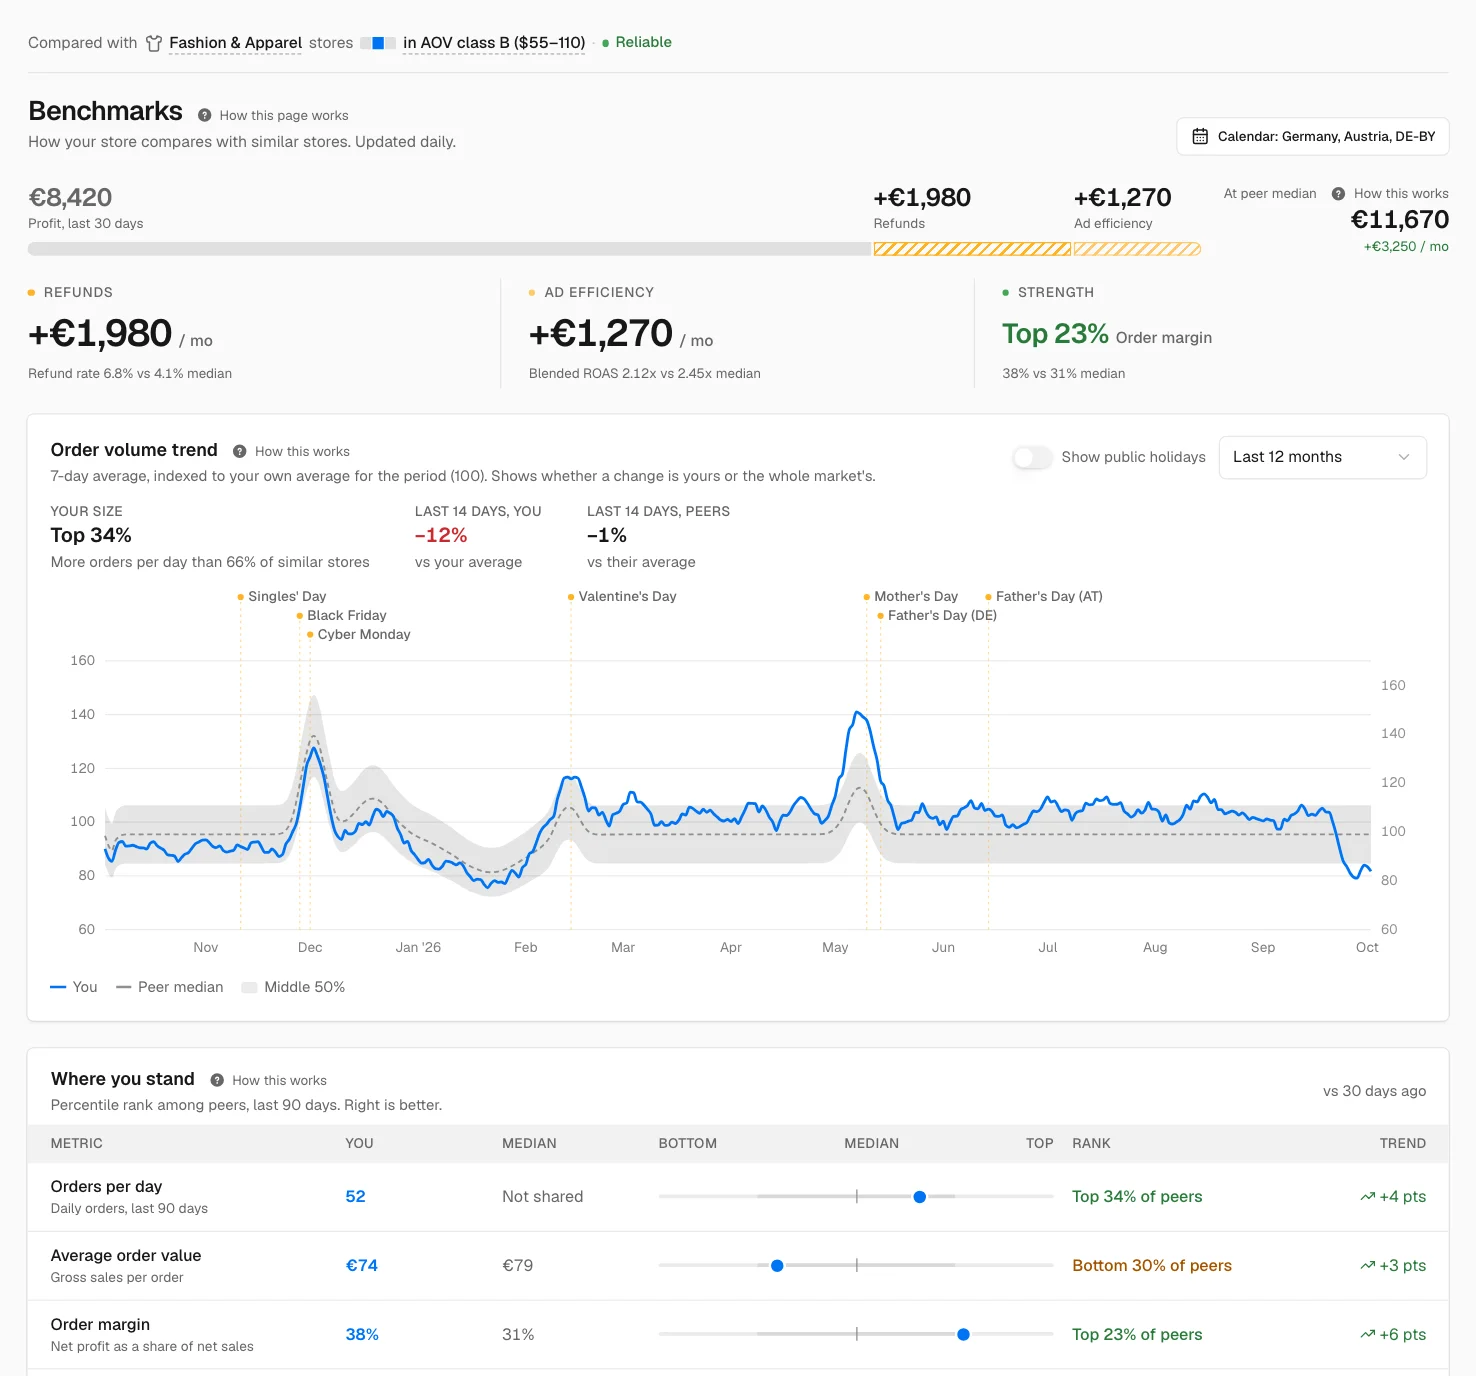
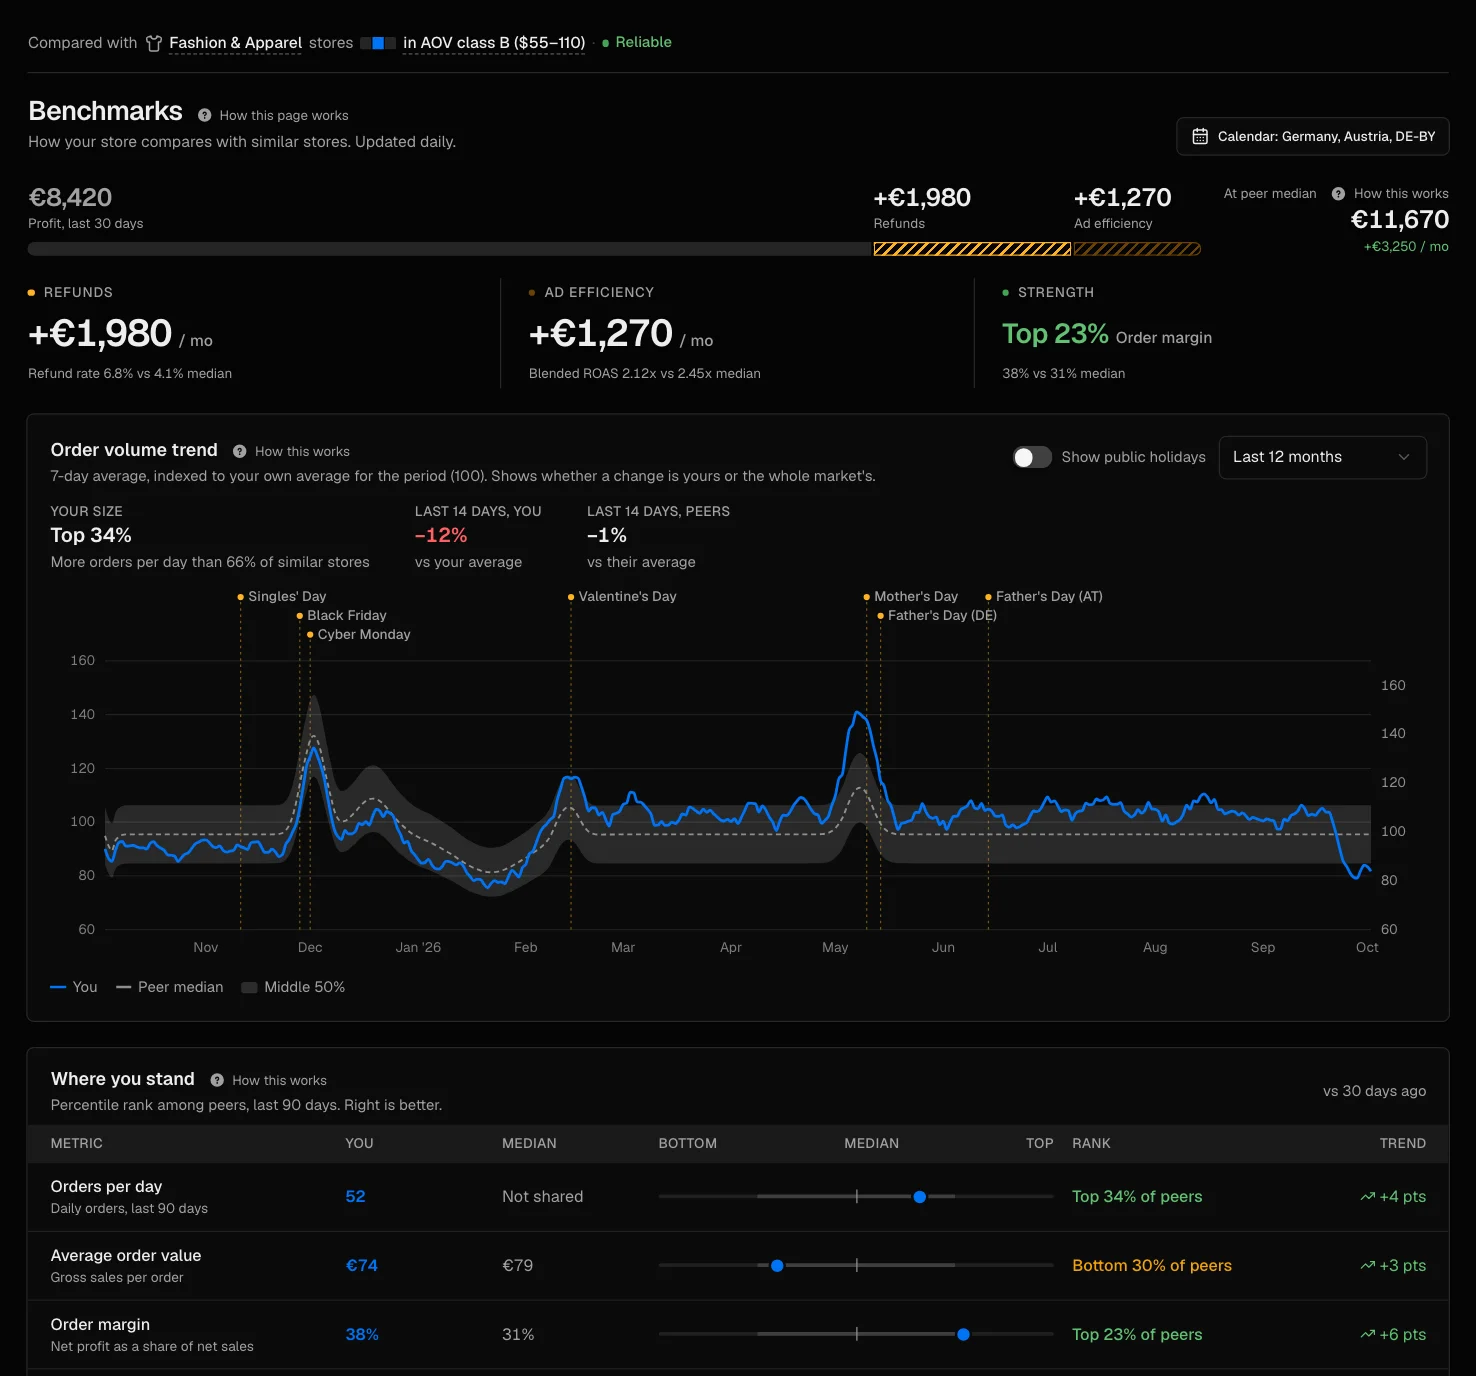
Benchmarks

See how your store compares to stores like yours

Your margins, order value, ad efficiency and refunds next to stores in the same category and price range. Based on real order data, refreshed daily.

Sample data
See how your store compares to stores like yours

How it helps

Shopify benchmarks from stores like yours, not industry averages

Published ecommerce benchmarks mix every kind of shop, so they say little about yours. Shopify benchmarks in Profitario compare your margin, ROAS, refunds and order value with stores in your category and price range, anonymously.

  1. 01

    Know whether a number is good

    Each metric shows your percentile rank against your peer group, a Shopify store comparison that published averages cannot give you. A 2x ROAS can be weak in one category and strong in another, and the rank tells you which.

  2. 02

    Prioritize the gaps worth closing

    Every metric has its own benchmark, from average order value to refund rate. Where you trail the median, the report shows what closing the gap is worth per month at your current volume, so you start with the change that adds the most profit.

  3. 03

    Time launches to your market

    Order volume by hour and weekday next to similar stores shows when your market buys, and with it the best time to run ads, launch products and send emails.

Features

What the report shows

Loading 0%

Ranking against 214 stores0%
Where you stand

Fashion & Apparel · $55-110 orders

  • Order margin

    33%

    62nd
  • Order value

    $68

    71st
  • ROAS

    2.1×

    38th
  • Returning

    28%

    54th
BottomMedianTop

Where you stand

Percentile rank for margin, order value, ROAS, refunds, returning customers and more, against stores in your category and price range.

Valuing the gaps0%
What the gaps are worth

If you reach the peer median

+$3,890/mo46%
  • Refunds6.8% vs 4.1% median+$1,980/mo
  • Ad efficiency2.12× vs 2.45× median+$1,270/mo
  • Cost per order$16.10 vs $15.50 median+$640/mo

What the gaps are worth

Where you trail the median, and what closing each gap is worth per month at your current volume.

Comparing hours0%
Today vs a typical day

Orders by hour, indexed

Top 34%
0
20
40
60
0h6h12h15h21h
YouPeers, middle 50%

When your market buys

Order volume by hour and weekday next to stores like yours, so you know when your market buys.

Hiding store names0%
Peer group

Order margin across the peer group

Names hidden
You · 62th
Lower marginMiddle 50% of 214 storesHigher

Anonymous in both directions

No store names or order counts. Your numbers only appear inside group ranges, and you only see the ranges of others.

Running the example store0%

Refund rate

Your store inside the peer ranges, 214 stores

0%
3%
6%
9%
Top 25%
Middle 50%
Bottom 25%
Peer median 4.1%
6.8% · bottom 25%
JanAprJulOctDec
  1. 01 · CompareSee where you trail6.8% vs 4.1%
  2. 02 · CloseClose the gap worth the most+$1,980/mo
  3. 03 · LeadAim for the top quarter3.1%

Refunds sit in the bottom quarter of 214 similar stores. The peer median is 4.1%.

In the report: Percentile rank per metric

Grow toward what similar stores already reach

Example: a fashion store with a 6.8% refund rate.

Questions it answers

From a question to the next step

  1. 01 · You ask

    Is my margin good for my category?

    Why it matters: A margin can feel fine and still sit well below similar stores. Without a comparison, you may accept a pricing or cost problem as normal.

    The report shows

    Your percentile against stores in the same category and price range.

    You act

    If you sit in the bottom half, look at product costs and shipping before chasing more revenue.

    Where your 33% sits

    Order margin · 214 stores, $55-110 orders

    62ndAbove median
    0
    20
    40
    60
    <15%15-2020-2525-3030-3535-4040-4545%+
    Stores
  2. 02 · You ask

    Is my ROAS low, or is the category low?

    Why it matters: If the whole category runs at a low ROAS, cutting ads would cost sales without fixing anything. If only your store is low, the ads need work.

    The report shows

    Your blended ROAS next to the peer median, per platform.

    You act

    If the whole category runs at a low ROAS, compete on order value and repeat purchases instead of bids.

    ROAS by platform

    Blended 2.1× · peer median 2.4×

    YouPeer median
    • Google Ads
      2.9×
      3.2×
    • Meta Ads
      2.0×
      2.3×
    • TikTok Ads
      1.2×
      1.4×
    YouPeer median
  3. 03 · You ask

    Which gap should I close first?

    Why it matters: Time and budget are limited. Ranking gaps by their value in money shows which improvement pays back first.

    The report shows

    Each gap to the median, valued per month at your current volume.

    You act

    Start with the gap worth the most per month.

    Gaps by value

    Value of reaching the peer median

    +$3,890

    Per month

    • Refunds$1,98051%
    • Ad efficiency$1,27033%
    • Cost per order$64016%
  4. 04 · You ask

    When should I launch and spend?

    Why it matters: Spend and launches work better when your market is buying. Knowing the peak hours and days stops budget from going out when demand is low.

    The report shows

    Order share by weekday and hour next to your peer group.

    You act

    Schedule launches, emails and budget increases for the hours and days your market buys most.

    When your market buys

    Weekday × time of day · you vs peers

    6h9h12h15h18h21h
    Mon1.02.12.72.63.54.2
    Tue0.81.82.42.23.13.6
    Wed0.81.82.42.23.13.6
    Thu0.81.72.22.12.93.4
    Fri0.81.82.42.23.13.6
    Sat0.71.41.91.82.42.9
    Sun1.12.33.12.94.04.7
    Share of weekly ordersLowHigh

Common questions

Questions about the Benchmarks report

It varies by category and price range, which is why a single average is misleading. Benchmarks shows the margin range of stores like yours and where your store ranks inside it.

Start tracking your real profit today

No credit card required. Free plan available forever.

We value your privacy
We use cookies to enhance your experience. By continuing to use our site, you consent to our use of cookies.

By clicking "Accept All", you consent to our use of cookies.

Learn more