

Pivot Table

Every number, cut the way you need it

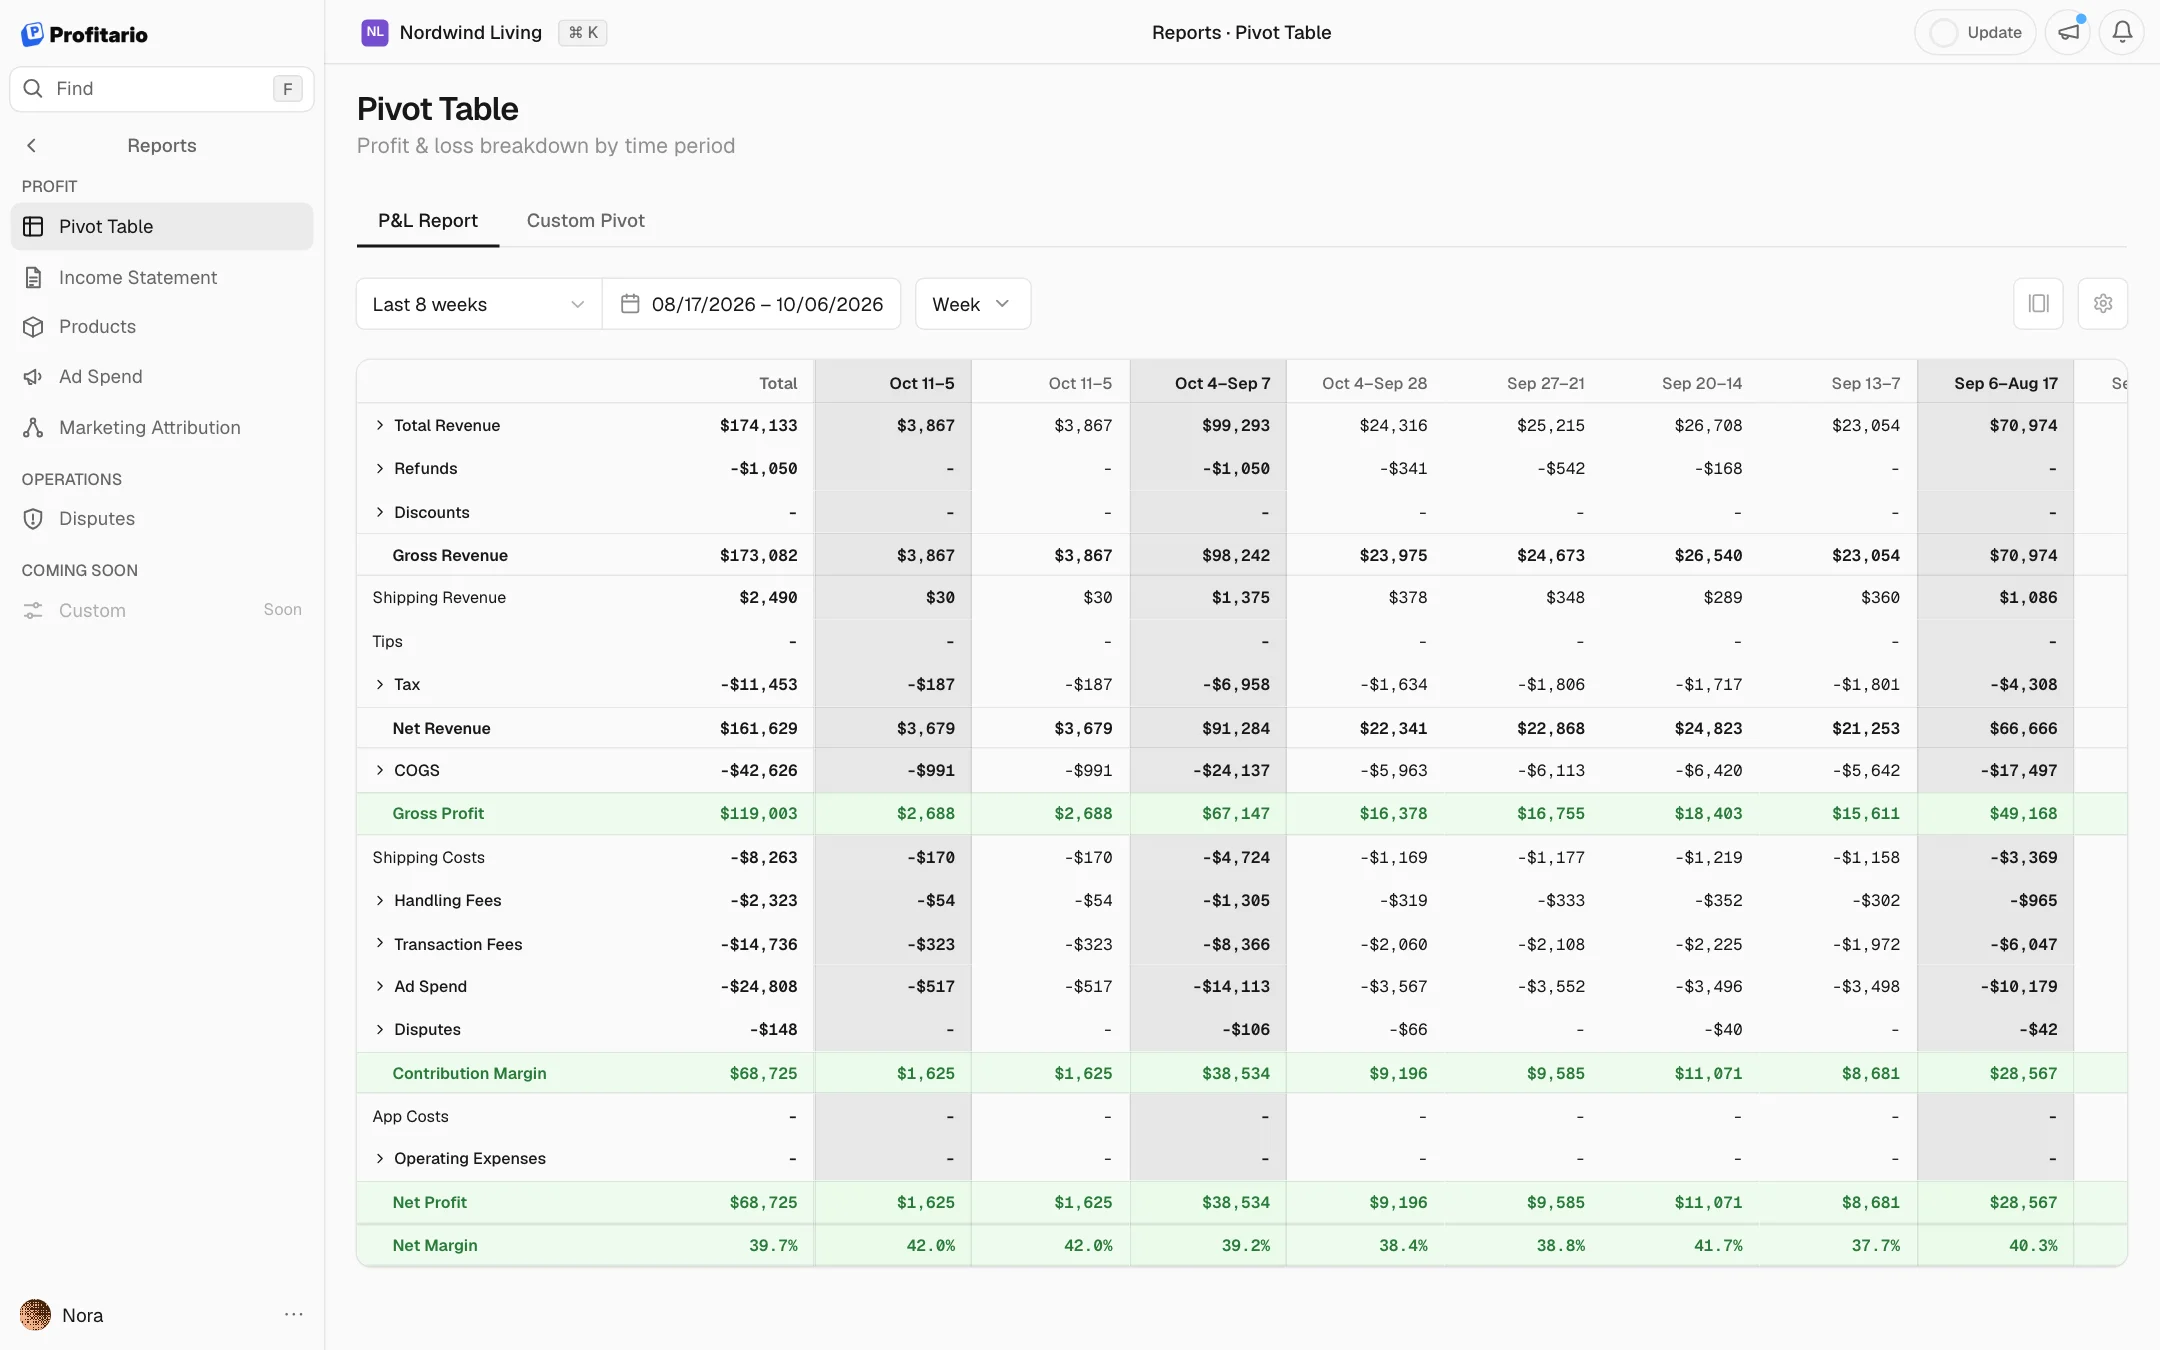
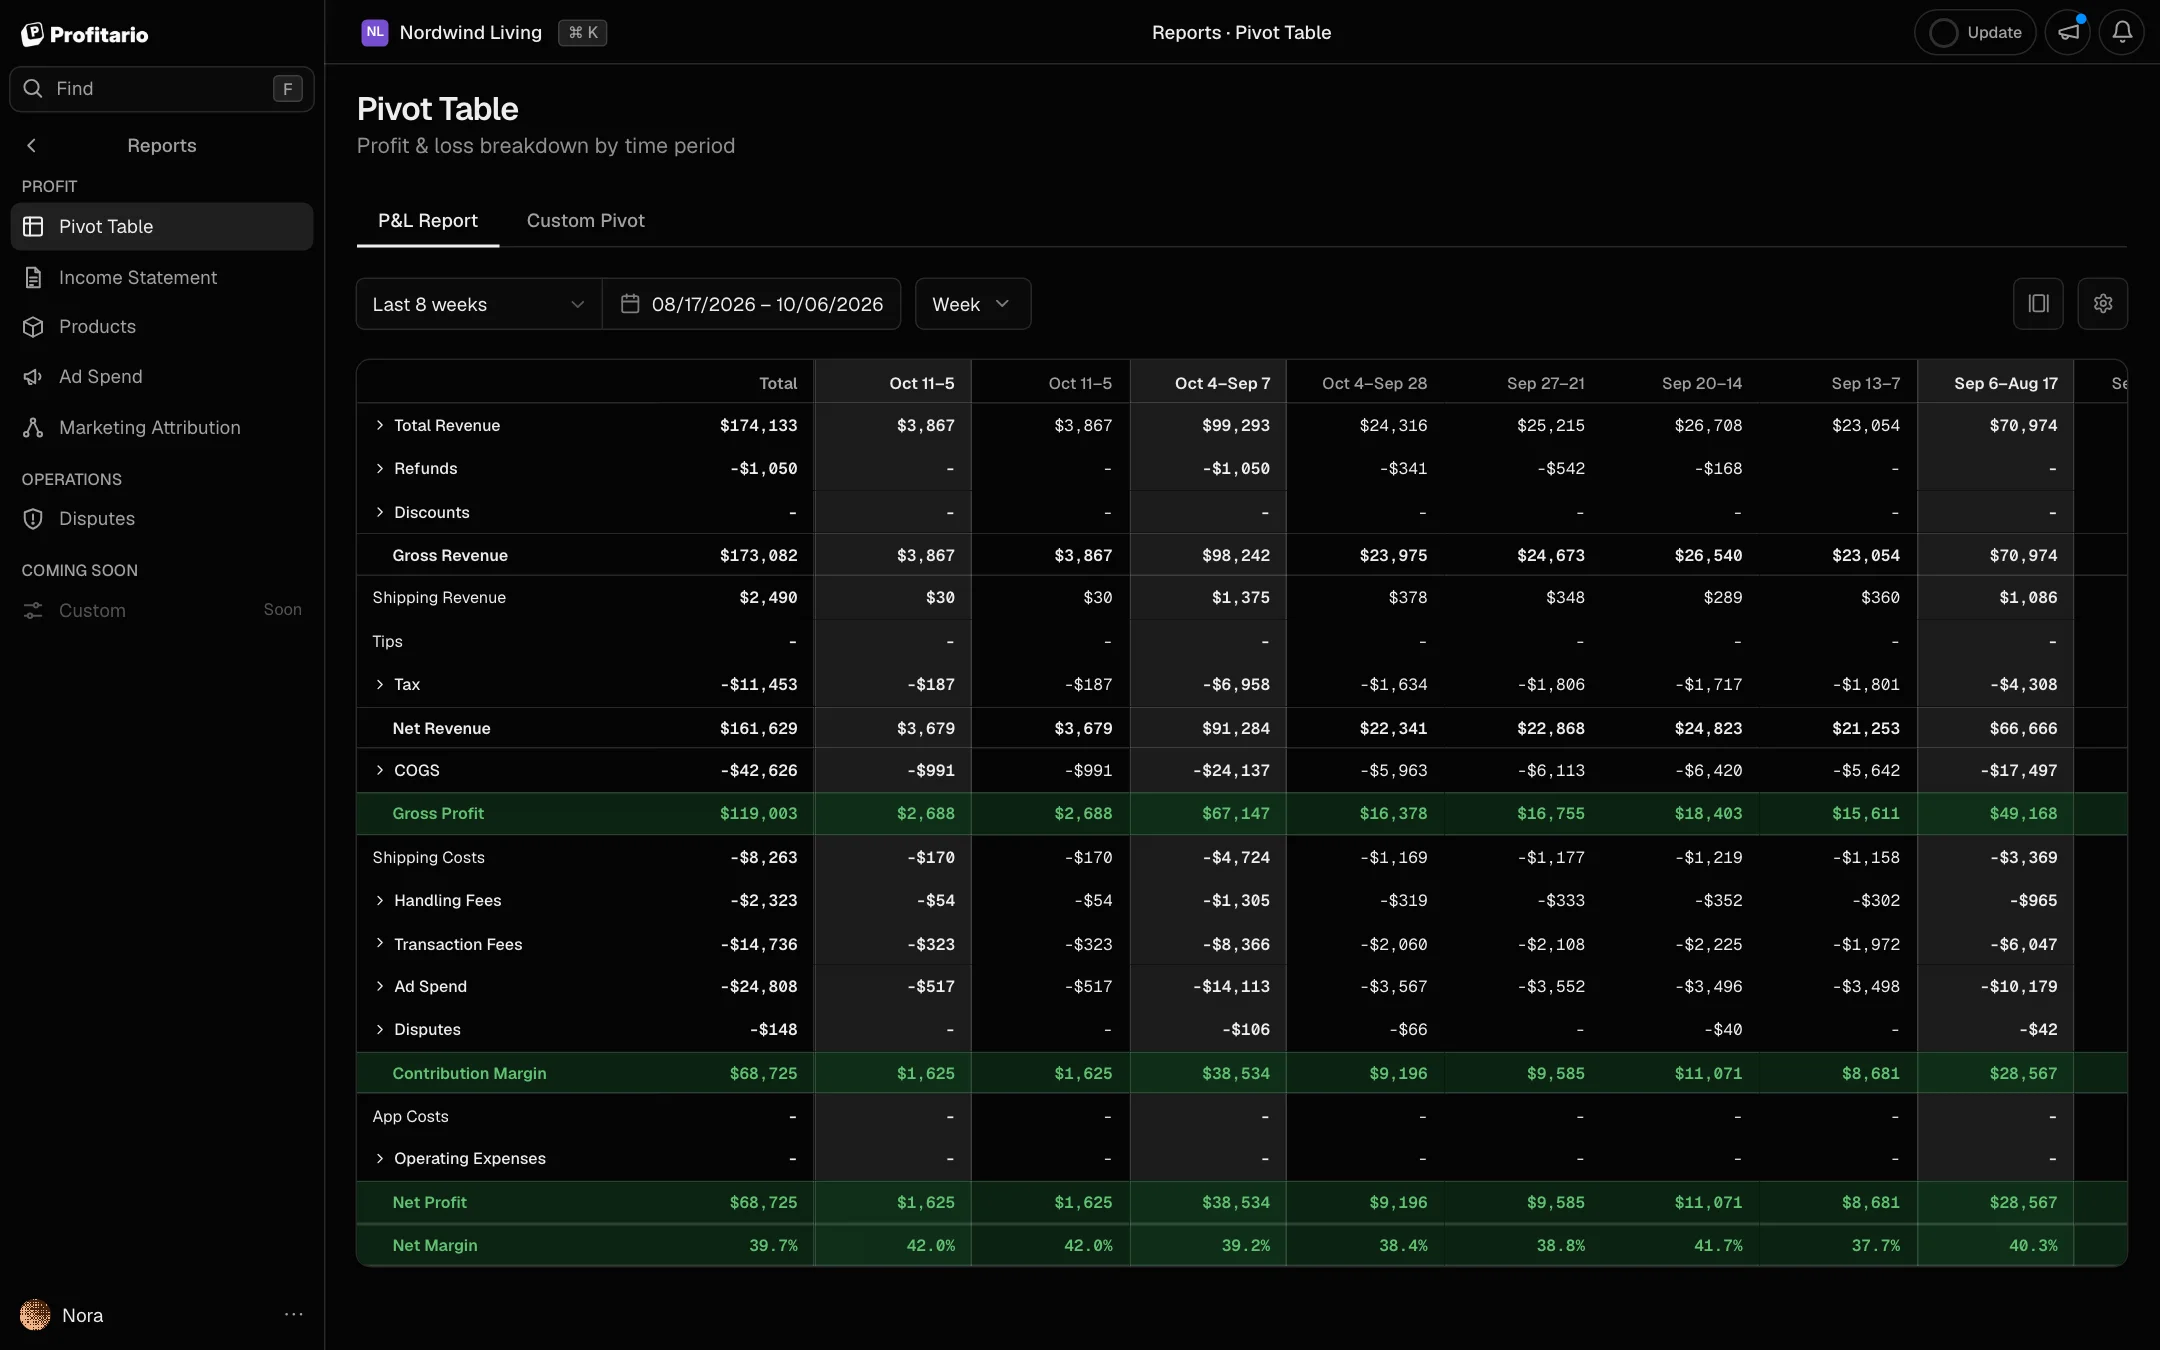
A P&L by day, week or month, plus a custom pivot that groups profit by product, product type, vendor, country or sales channel.

Sample data
Every number, cut the way you need it

How it helps

A Shopify pivot table report with profit, not just sales

Most pivot tables start with a sales export and end in a spreadsheet you rebuild every month. The Shopify pivot table report in Profitario does the same cut with costs already included, so every cell can show net profit.

  1. 01

    Profit and loss by any period

    Revenue, refunds, each cost and net profit as rows, periods as columns, with subtotals on every level. Switch to weeks for a weekly profit report or to months for a monthly P&L, and the table rebuilds without a formula.

  2. 02

    Margin by product, vendor or country

    Put product, product type, vendor, country or sales channel in rows and columns. Shopify can show gross profit per location; this view adds shipping, fees and ad spend, so you see profit by product, by vendor and by country at net margin.

  3. 03

    Costs broken out line by line

    Ad spend per platform and account, expenses by category per month, disputes and taxes each get their own row. A cost that grows month after month stands out next to revenue.

Features

What the report shows

Loading 0%

Building the P&L0%
Profit by period

P&L report

DayWeekMonth
MetricMonTueWedThu
Revenue$1.7k$1.8k$2.0k$1.8k
COGS-$0.7k-$0.6k-$0.7k-$0.7k
Ad spend-$0.4k-$0.4k-$0.4k-$0.4k
Shipping-$0.2k-$0.1k-$0.2k-$0.1k
Net profit$0.5k$0.6k$0.5k$0.5k

P&L by period

Revenue, refunds, every cost and net profit as rows, days, weeks or months as columns. Switch the period and the table rebuilds.

Pivoting by vendor0%
Custom pivot

Rows: vendor · Columns: month

JulAugSepOct
Nordic Home48%50%52%48%
Atelier Co.41%43%39%41%
Lumen34%30%32%34%
Basics Ltd.21%23%25%21%
Gross margin by vendor and monthLowHigh

Custom pivot

Choose what goes into rows and columns: product, product type, vendor, country or sales channel.

Rolling up days0%
Subtotals

Days roll into weeks

PeriodRevenueProfit
Week 40
$12,480
$3,410
Oct 1
$1,840
$518
Oct 2
$2,010
$604
Oct 3
$1,560
$402
Week 41
$13,120
$3,760
Week 42
$11,860
$2,940

Subtotals that add up

Days roll into weeks, weeks into months, months into years, with subtotals on every level.

Splitting costs0%
Costs broken out

Share of total costs by month

  • Jun
  • Jul
  • Aug
  • Sep
  • Oct
COGSAd spendShippingFeesExpenses

Costs broken out

Ad spend per platform and account, expenses per category, disputes and taxes, each on its own row.

Running the example store0%

Net margin by weekday

Pivot: weekdays by month

Rows: WeekdayColumns: MonthValue: Net margin
AprMayJunJulAugSepOct
Mon
Tue
Wed
Thu
Fri
Sat
Sun
+$40 a day on Sundays from October
October: Sunday at 33%
  1. 01 · SpotSpot the pattern31% vs 22%
  2. 02 · ActAct on it$40 a day
  3. 03 · CheckCheck that it held33%

Sundays run at 31% margin against 22% on other days, every month since April.

In the report: Weekdays as rows, months as columns

Find the pattern, then repeat it

Example: net margin by weekday, April to October.

Questions it answers

From a question to the next step

  1. 01 · You ask

    What was my profit each week this quarter?

    Why it matters: Monthly totals hide the weeks that went wrong. Weekly profit shows when a change in pricing, ads or costs started to matter.

    The report shows

    Net profit per week as columns, with the quarter total at the end.

    You act

    Compare each week with its neighbours and look for the week where costs jumped, not just where revenue dropped.

    Weekly profit

    Rows: measure · Columns: week

    $56,410
    $0
    $10,000
    $20,000
    $30,000
    $40,000
    W33W34W35W36W37W38W39W40
    Net profitAd spendOther costs
  2. 02 · You ask

    Which vendor has the best margin?

    Why it matters: Vendors with similar sales can leave very different margins. Knowing which one earns more guides what to reorder and what to renegotiate.

    The report shows

    Vendors as rows with revenue, costs and margin.

    You act

    Reorder more from the vendor with the best margin and renegotiate with the weakest.

    Vendors

    Rows: vendor · Value: gross margin, Q3

    MarginRevenue
    • Nordic Home

      Costs $7.4k

      48%
    • Atelier Co.

      Costs $13.6k

      37%
    • Lumen

      Costs $6.8k

      31%
    • Basics Ltd.

      Costs $15.3k

      19%
  3. 03 · You ask

    Which countries earn me money?

    Why it matters: Shipping, duties and fees differ by country, so a country with strong sales can still lose money. Profit by country shows where to grow and where to raise prices.

    The report shows

    Countries as rows, months as columns, net profit as the value.

    You act

    If a country keeps a thin margin, adjust its shipping price or stop advertising there.

    Net profit by country

    Rows: country · Columns: month · Value: net profit

    CountryJulAugSepQ3
    • Austria
      $910
      $1,020
      $1,030
      $2,960
    • Germany
      $4,020
      $4,110
      $4,350
      $12,480
    • Netherlands
      $640
      $720
      $810
      $2,170
    • Switzerland
      -$120
      -$180
      -$110
      -$410
    Total
    $5,450
    $5,670
    $6,080
    $17,200
  4. 04 · You ask

    What did each expense category cost per month?

    Why it matters: Fixed expenses creep up through new apps and services. Seeing each category per month shows which ones grow faster than revenue.

    The report shows

    Each expense category as a row, months as columns.

    You act

    Bring the table to the monthly review instead of rebuilding it in a spreadsheet.

    Expenses by category

    Rows: category · Columns: month

    $4,1007%
    $0
    $1,000
    $2,000
    $3,000
    $4,000
    $5,000
    JunJulAugSepOct
    WarehouseSoftwareFreelancers

Common questions

Questions about the Pivot Table report

Shopify reports sales by month but not net profit after ad spend and expenses. In the Pivot Table report, set months as columns to get a profit and loss statement per month.

Start tracking your real profit today

No credit card required. Free plan available forever.

We value your privacy
We use cookies to enhance your experience. By continuing to use our site, you consent to our use of cookies.

By clicking "Accept All", you consent to our use of cookies.

Learn more